MyEMS Architecture Design Document
Download: MyEMS开源能源管理系统架构设计文档.pdf
| Item | Content |
|---|---|
| Document | MyEMS Open-Source Energy Management System Architecture Design |
| Document version | 6.9.0 |
| System version | Community Edition v6.9.0 |
| Prepared by | Beijing Haisoft Software Co., Ltd. |
| Date | October 2026 |
This document describes the overall architecture, component boundaries, data organization, interface conventions, and deployment shape of MyEMS Community Edition, based on the actual code layout and database structure. Where this document disagrees with the source code or the official docs, the source code and the official docs prevail.
1 Introduction
1.1 Purpose
The document is a shared technical baseline for architecture review, implementation, operations, and extension. It does two things:
- It pulls the website feature notes, component READMEs, and the database design into one architecture view, so implementers do not have to reconstruct the system only by reading source code.
- It states the trade-offs, so readers know which boundaries can be extended and which ones, once broken, ripple across many components.
This document does not replace the installation guide or the API manual.
1.2 Scope and readers
The document covers all 11 Community Edition components (including the database) and the 13 business databases. It does not describe Enterprise Edition features in implementation detail.
| Reader | Suggested chapters |
|---|---|
| Technical leads and architects | Chapters 3, 4, 6, and 11, for technology choices and extension boundaries |
| Implementation and operations engineers | Chapters 5, 7, 9, and 10, for deployment, troubleshooting, and capacity |
| Developers extending the system | Chapters 5, 6, 8, and 12, for integration and new features |
Performance and capacity figures are estimates from the data structures and service shape. They have not been measured under production load. Those paragraphs are marked as estimates.
1.3 Terms
| Term | Meaning in the system |
|---|---|
| Energy category | A metered energy type, such as electricity, water, natural gas, chilled/hot water, or steam. It carries the unit of measure plus kgce and kgCO2e factors. Table: tbl_energy_categories |
| Energy item | Use-based breakdown under a category, such as HVAC, power, or lighting. Table: tbl_energy_items |
| Space | The hierarchy that organizes energy data (campus, building, floor, room). A self-reference on parent_space_id forms the tree, which is the usual filter for reports |
| Meter | The smallest business unit of metering. It binds one energy category; its points hold the readings. Offline meters (manual entry) and virtual meters (expression) are derived forms |
| Point | The smallest collected value. Types are analog, digital, energy, and text. object_type and object_id attach a point to a meter or equipment |
| Data source | A group of targets that share a protocol and connection. The connection field stores address and interval as JSON |
| Combined equipment | A system made of several pieces of equipment and meters (for example a chiller plant), used to account for input and output energy |
| 8760 model | An annual hourly model (8,760 hours). Table names end with _8760. Used for forecasting and budgeting |
| kgce / kgco2e | Kilograms of coal equivalent and kilograms of CO2 equivalent, the common conversion basis for energy and carbon |
This table is a reading aid, not a data dictionary. Field-level definitions are in Chapter 6 and the database design document.
1.4 References
- MyEMS website: https://myems.cn
- MyEMS repository (Gitee): https://gitee.com/myems/myems
- Community Edition feature list
- Introduction and compatibility list
- Database design document
- API manual
- Docker Compose installation guide
- Administrator manual
- GB/T 23331-2020, Energy management systems — Requirements with guidance for use (identical to ISO 50001:2018). Published 2020-11-19, effective 2021-06-01.
2 System overview
2.1 Positioning
MyEMS is an open-source energy management system for energy-using organizations. It follows GB/T 23331-2020 (ISO 50001:2018) and covers collection, analysis, and reporting of electricity, water, gas, cooling, and heat for buildings, factories, malls, hospitals, campuses, and energy-carbon centers. It keeps three accounting lines: energy, cost, and carbon. Public materials cite more than a thousand project cases and CMA testing. The code is MIT-licensed. The Community Edition requires the copyright notice and logo to be kept.
Compared with a generic SCADA package or a plain data platform, MyEMS centers on modeling metering relationships. Spaces, meters, equipment, tenants, stores, shopfloors, and combined equipment share one set of aggregated results, so the same energy figures can be opened along organizational, physical, and commercial dimensions. That choice makes the data model heavier than a typical monitoring system, and it drives most of the architecture decisions below.
2.2 Functional domains
- Collection. Modbus TCP, BACnet/IP, Siemens S7, and OPC UA connect field instruments and controllers. Offline meters and Excel import cover points that cannot be networked or must be read by hand.
- Monitoring and analysis. Meter trends, master/sub-meter balance, batch and comparison analysis, power quality, and category, item, load, efficiency, and statistics for spaces and equipment. Intensity can be per area or per product.
- Accounting. Energy is priced into cost and factored into carbon. Reports compare a reporting period with a baseline period. Plans, baselines, and forecasts are supported.
- Reporting. Analysis pages export real xlsx files with tables and line, bar, and pie charts, not CSV text. Advanced reports add templates, schedules, and email delivery.
- Configuration. Spaces, meters, points, data sources, protocols, equipment, combined equipment, cost centers, tariffs, working calendars, users, and privileges.
- Extensions. The Community Edition includes AI conclusions and saving advice through DeepSeek and the OpenAI API. Photovoltaics, storage, EV chargers, microgrids, virtual power plants, control, fault diagnosis, and work orders are Enterprise Edition capabilities.
2.3 System boundary
Upstream are meters, PLCs, building automation, and PV/storage monitoring interfaces. Downstream are browsers, mobile clients, large screens, and third-party systems on the REST API. Inside the boundary the system fetches numbers, calculates them, displays them, and emits reports. It does not provide SCADA graphics, trade-settlement metrology, a message bus, or a stream processor.
A direct consequence: freshness is defined by the collection interval (configured per data source; the sample is 60 seconds). Components exchange data only through database tables. There is no event bus. That fact is the premise of the runtime shape in Chapter 4 and the decisions in Chapter 11.
2.4 Version and license
The current release is v6.9.0, the 49th release. The cadence is one minor version per month and one major version per year. Upgrades must apply the schema changes in the CHANGELOG and the upgrade document.
The license is MIT. Commercial use and modification are allowed, but the Community Edition requires MyEMS copyright text and the logo to remain. Renaming or replacing the brand is explicitly unsupported. That compliance boundary must be confirmed before white-label delivery.
3 Goals and principles
3.1 Design goals
- One model for many protocols and energy types. Heterogeneous instruments are normalized onto the same point model. A new protocol must not pull upper layers with it.
- Traceable accounting. Every energy, cost, and carbon figure can be traced to a meter, a point, and a time range, and keeps a data-quality flag.
- Many dimensions. The same energy supports space, equipment, tenant, store, shopfloor, and combined-equipment views, including recursive hierarchy queries.
- Low-friction delivery. A single host can be deployed with docker-compose, on several Chinese operating systems and MySQL-family databases, including private and offline sites.
- Extension and integration. The external surface is the REST API plus JSON import/export. The internal surface is the table structure. New protocols and reports can be added without changing the core services.
3.2 Design principles
- One source of truth. Each measurement is produced by one point. Every derived value can be recomputed from it. There is no second raw series that must be maintained by hand.
- Compute and storage are split by purpose. Raw series, normalized energy, multi-dimensional aggregates, and derived accounting values live in different databases, so one database does not have to absorb every workload.
- Dimensions are materialized ahead of time. Aggregates are stored as object × direction × classification × grain. Storage is spent so report pages do not scan at request time.
- Time is UTC. Every timestamp is stored in UTC and converted to local time in the presentation layer.
- Configuration-driven. Targets, intervals, point addresses, and aggregation scope come from the database. Service processes stay as stateless as practical, so they can be containerized and restarted.
- Recomputable. Any calculation stage can be rerun for a time range.
is_publishedandis_baddecide whether a value reaches an external report, so a wrong factor does not require rebuilding the whole database.
3.3 Constraints
The stack is fixed. The backend is Python. The API uses Falcon on gunicorn or waitress. The web UI is React and the admin UI is AngularJS 1.x. The database is the MySQL family. The published compatibility list includes MySQL 8.0/5.7, MariaDB 11/10, Percona Server, SingleStore 8.0/7.8, GoldenDB 3.0/2.0, and OceanBase 4.2/3.2. The Enterprise Edition also supports SQL Server, Oracle, and GreatDB.
That list is both a capability and a constraint. Cross-database compatibility means the system can use only the SQL subset those products share. It cannot depend on a vendor window function, JSON function, or partitioning syntax. That is why Chapter 6 expresses business meaning in table structure rather than in SQL.
4 Overall architecture
4.1 Layered architecture
There are five logical layers. Collection turns field signals into raw values. Storage holds raw, aggregated, and derived values by purpose. Computation turns raw values, on a time cadence, into multi-dimensional energy, cost, and carbon. The service layer exposes query, calculation, and export over REST. Presentation splits into an analysis UI and an administration UI. Cross-cutting concerns (privileges, configuration, languages, logs, containers, multi-database support) sit beside the layers.
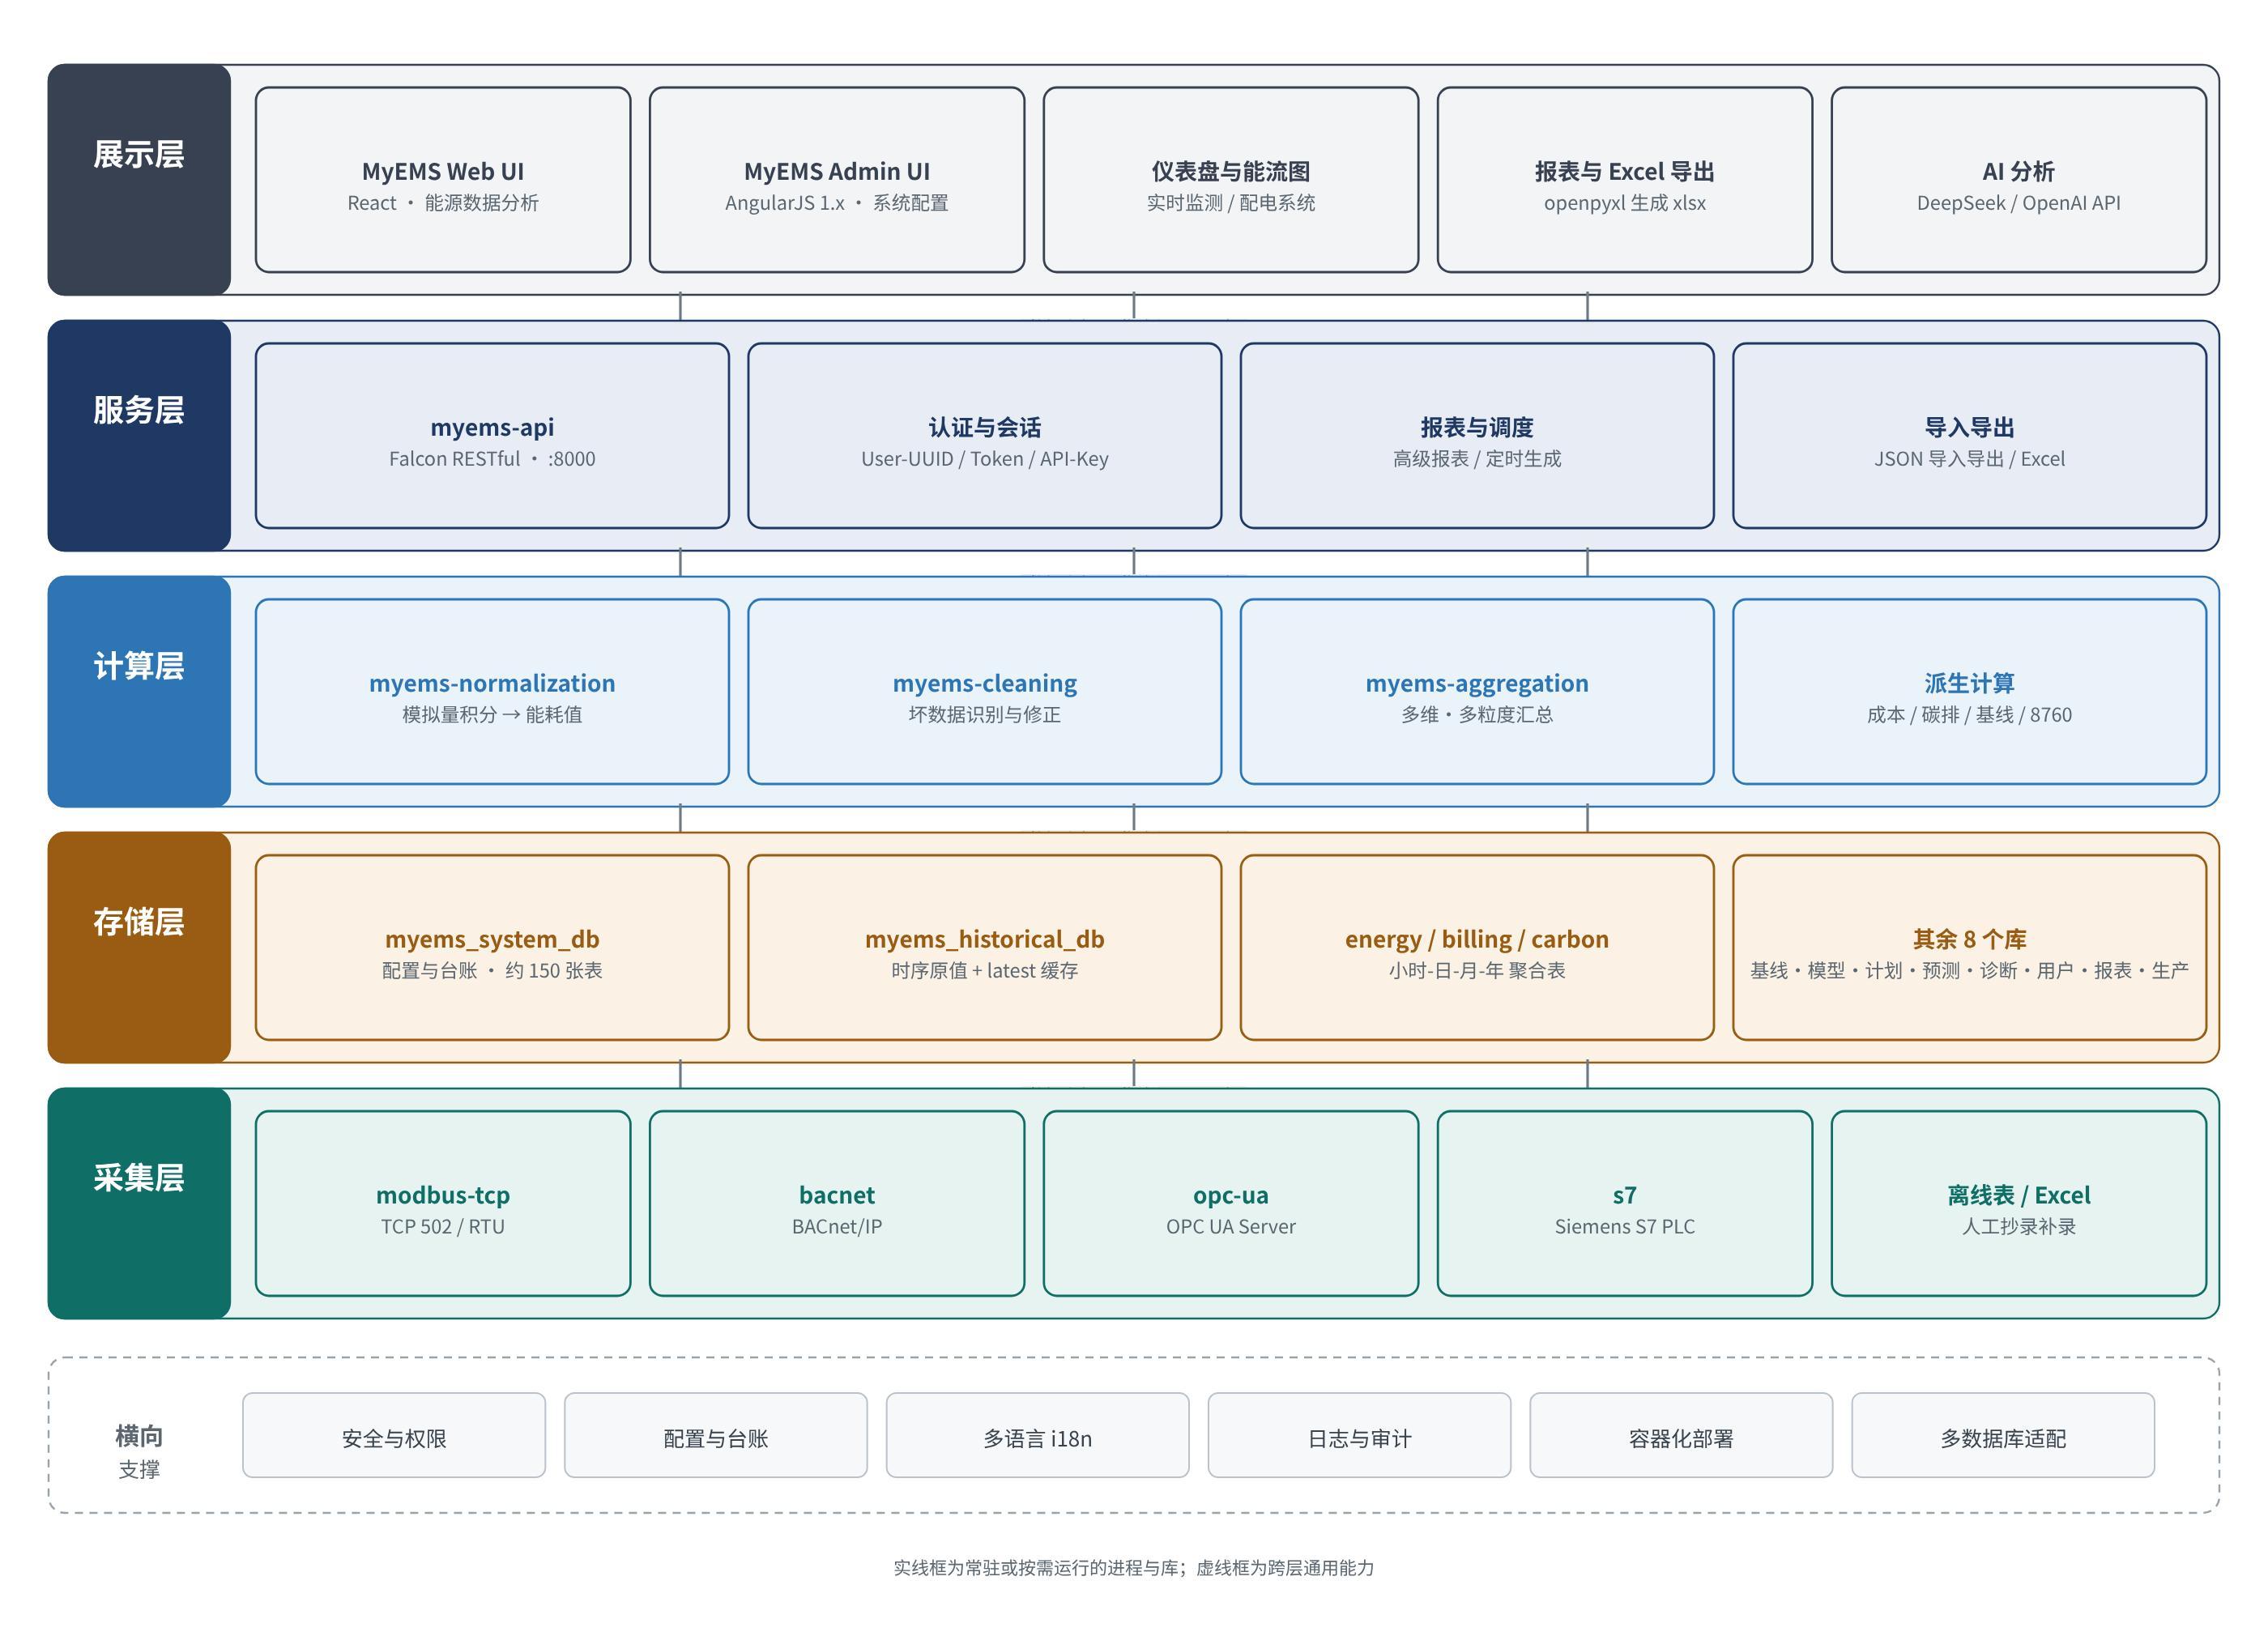
The layers match deployment units. Each collection and computation component is its own process or container and can be started, stopped, and scaled alone. The service layer is the only external HTTP entry. Presentation is two sets of static files. Process isolation on a single host means a failing protocol collector does not take down the API.
4.2 Layer responsibilities
Collection. One service per protocol reads registers or nodes on the data-source interval and writes the raw time-series database. The service does not interpret business meaning. It parses the protocol and converts types. Which business object a point belongs to is object_type and object_id in the configuration database.
Storage. Thirteen databases hold different kinds of data. The system database holds master data. The historical database holds raw series. Energy, billing, and carbon hold aggregates. The remaining databases hold baselines, models, plans, predictions, diagnostics, users, reports, and production. There are no foreign keys across databases. The application joins them.
Computation. Three services form a pipeline. Normalization turns raw values into hourly energy. Cleaning flags or corrects bad values. Aggregation materializes seven object types at four time grains. Each stage takes a time range, so each stage can be rerun.
Service. myems-api is the only data exit. It authenticates, routes resources, builds reports, and exports Excel. It holds no business state. State lives in the database and the session table, so several API instances can share one database.
Presentation. The web UI is for energy analysts: charts, reports, and export. The admin UI is for administrators: master data and collection configuration. Both are static sites served by nginx, which reverse-proxies the API.
4.3 Components and how they collaborate
Components do not call each other. They couple through tables. Collectors write the historical database. Computation reads it and writes result databases. The API reads all of them. The configuration database is the most referenced node: collection, computation, authentication, and reporting all read it.
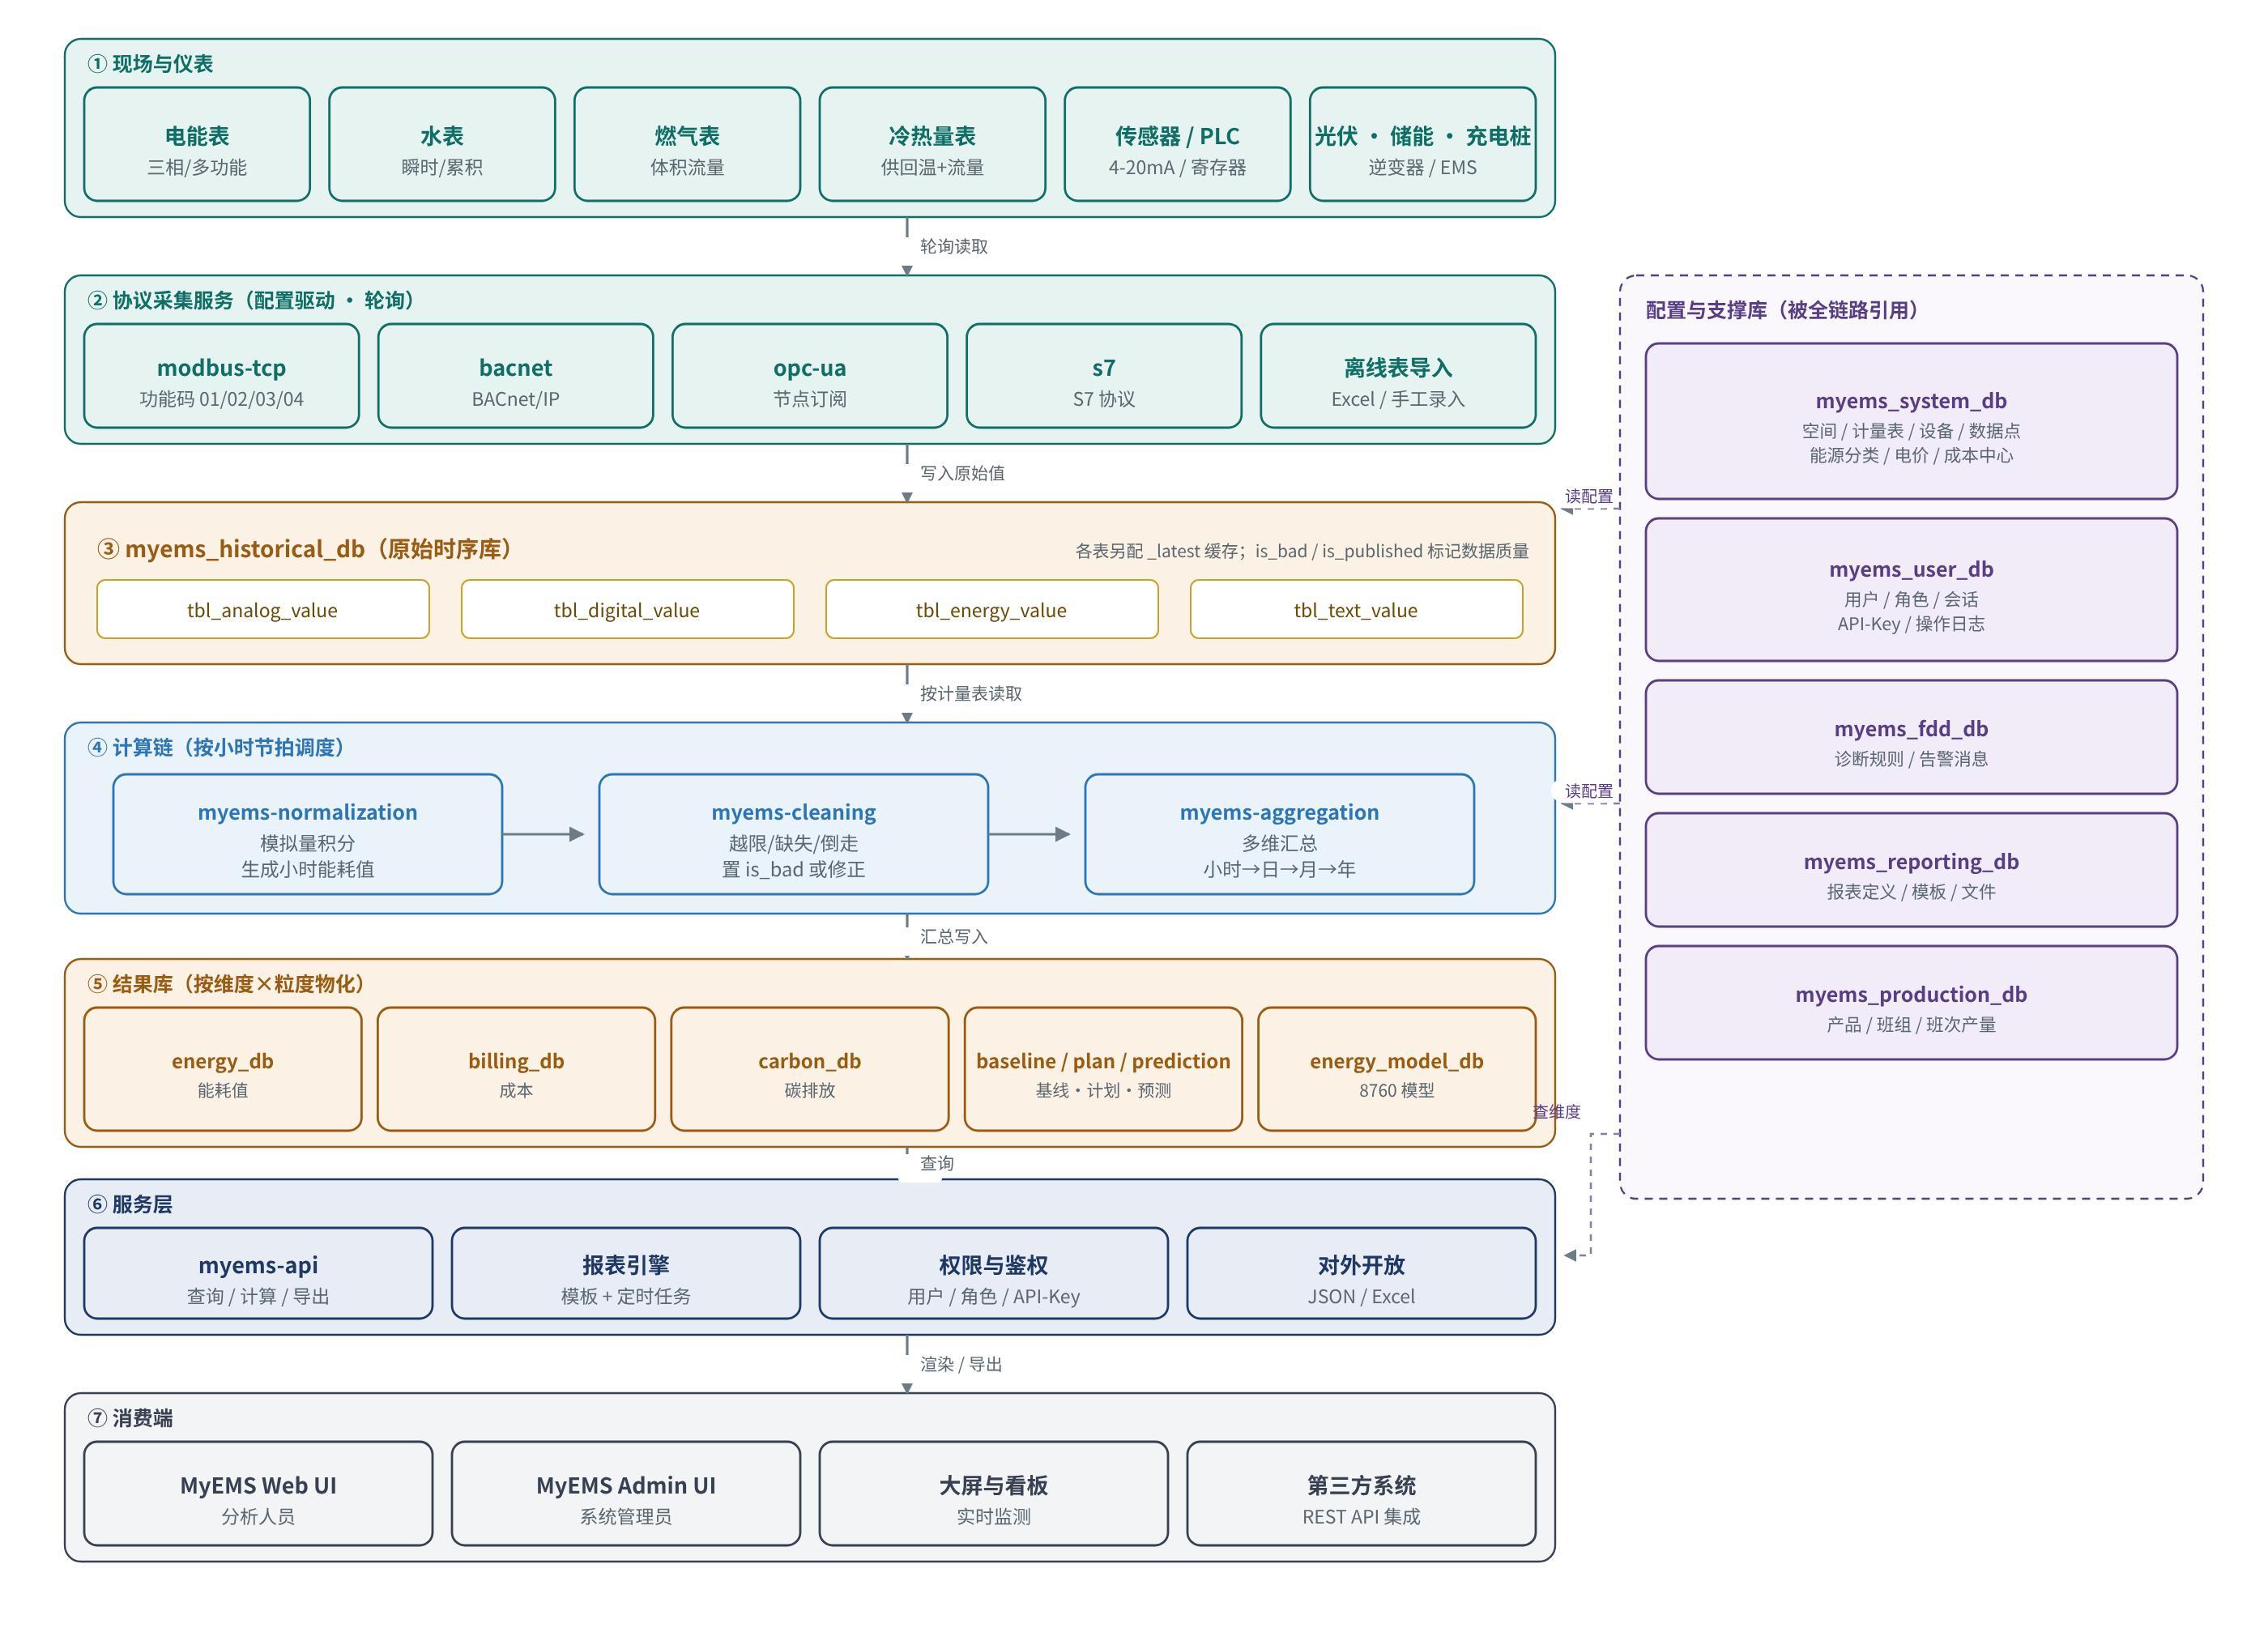
A shared database is simple to deploy, needs no middleware, and runs offline. The cost is that the contract between components is hidden in table structure. A schema change is a cross-component breaking change. Chapter 11 treats that as technical debt that has to be managed.
| Component | Runtime | Stack | Responsibility | Port |
|---|---|---|---|---|
| myems-database | Initialization scripts | MySQL DDL | Creates the 13 databases, all tables, and seed data | — |
| myems-api | Long-running service | Python, Falcon, gunicorn/waitress, openpyxl | REST, authentication, reports, Excel export | 8000 |
| myems-admin | Static site | AngularJS 1.x, nginx | Master data and collection configuration | 8001 |
| myems-web | Static site | React 16, ECharts, Chart.js, i18next, nginx | Energy analysis and visualization | 80 |
| myems-modbus-tcp | Long-running collector | Python, modbus_tk, schedule | Modbus TCP/RTU collection | — |
| myems-bacnet | Long-running collector | Python, BACnet/IP | Building-automation collection | — |
| myems-opc-ua | Long-running collector | Python, OPC UA | Reads an OPC UA server | — |
| myems-s7 | Long-running collector | Python, S7 | Siemens PLC collection | — |
| myems-normalization | Scheduled job | Python, mysql-connector, schedule | Raw values to hourly energy | — |
| myems-cleaning | Scheduled job | Python, schedule | Detect, correct, and flag bad data | — |
| myems-aggregation | Scheduled job | Python, mysql-connector | Multi-dimensional aggregates and derived accounting | — |
Ports are defaults and can be changed in nginx.conf and the container compose file. Collectors and computation services do not listen. They only open connections to the database and to field devices.
4.4 Runtime shapes
- Request/response. myems-api and the two front ends. Short requests, concurrency that follows the user count, failures that users notice immediately. Watch process health, the connection pool, and slow queries.
- Periodic polling. The four collectors. They sleep, wake on the data-source interval, and a single failure does not cancel the next cycle. Watch reachability and consecutive failures.
- Scheduled batches. Normalization, cleaning, and aggregation. They process a time range, concentrate database load, and a failure accumulates lag. Watch whether the schedule is stuck and whether each period is filled.
Failures look different. An API failure is seen at once. A collection failure shows up as missing data, often days later in a report. A batch failure shows up as aggregate tables that stop growing. The monitoring in Chapter 10 is split along these lines.
5 Component design
5.1 Protocol collectors
The four collectors share a skeleton: read matching data sources from the configuration database, parse address and interval from connection, read each point address, convert, and write the historical tables. They do not share code, but the contract is the same, so a new protocol can copy the skeleton.
For Modbus TCP, the data-source connection stores host, port, and interval. The point address stores slave id, function code, register offset, register count, data format, and a byte-swap flag. Function codes 01, 02, 03, 04, and 23 are supported. Byte order is a Python struct format. byte_swap swaps words of 32-bit or 64-bit values.
Data-source connection:
{"host":"10.9.67.99","port":502,"interval_in_seconds":60}
Point address:
{"slave_id":1,"function_code":3,"offset":0,"number_of_registers":2,"format":"<f","byte_swap":true}
Protocol differences are compressed into two JSON documents, so field commissioning happens in the admin UI rather than in code.
A hard constraint: after a data source or point changes, the collector must be restarted. Configuration is loaded at process start. There is no hot reload. The standard action is change configuration, restart the service, then check the data.
5.2 Normalization
Normalization turns raw point values into energy that has business meaning. Raw tables store instantaneous readings per point. Reports need “how much energy this meter used in this hour”, which requires aggregation and differencing along the meter-to-point binding. The service works in hourly slices, writes tbl_energy_value, and updates the matching _latest table.
This is the first time a value has an energy category and a unit. A wrong meter-to-point binding propagates into cost and carbon and is not rejected by a later stage. Checking those bindings is a prerequisite of acceptance.
5.3 Cleaning
Cleaning handles three cases: values outside a physical range, missing values inside a period, and cumulative values that run backwards (meter replacement or a communication fault). Some anomalies are flagged is_bad and excluded from later aggregation. Others are corrected by rule. is_published controls whether the value is released.
The point of the layer is to make data quality explicit. Most report disputes are bad data that was never isolated, not a wrong algorithm. The two Boolean flags keep quality next to the value, so a report can show both the number and how much it should be trusted.
5.4 Aggregation
Aggregation is where data volume grows, and it is the performance-critical stage. It reads normalized energy and computes seven object types (meter, equipment, combined equipment, space, store, tenant, shopfloor; meters also include offline and virtual meters) at four grains (hour, day, month, year) into the energy database. The same energy multiplied by the tariff is written to billing, and multiplied by the emission factor is written to carbon.
Cost and carbon are not collected. They are linear transforms of energy. After a tariff or factor change, rerunning the period corrects history without recollecting. The cost of that simplification is that time-of-use and tiered tariffs are non-linear and must be interpreted inside aggregation. They cannot be a single coefficient.
5.5 API
The API is Falcon and is the only exit for data. Resources are plural nouns. Meters, spaces, equipment, combined equipment, points, data sources, tariffs, and commands each have a path. Hierarchy is nested in the path, for example meters under a combined equipment. Non-CRUD actions are verbs on a sub-path: run an advanced report, send a command, clone a meter, export, and bulk import.
Excel export is a real xlsx built by openpyxl on the server, including table and chart objects. Advanced reports support a template, a schedule, and email. The expression is JSON on the report definition and describes the space scope and run conditions.
The service holds no business state. Sessions are in tbl_sessions and API keys are in tbl_api_keys. Multiple instances only need to share the database, which matters when many projects are hosted together.
5.6 Presentation
The web UI is React 16, with ECharts and Chart.js, Mapbox GL and Leaflet, i18next, and react-bootstrap-table. craco overrides the default Create React App build. nginx serves the static output. Maps need mapboxToken in src/config.js and showOnlineMap set to true. Offline sites should turn that switch off.
The admin UI is AngularJS 1.x and maintains master data. Two front-end stacks are a historical result: the analysis UI keeps moving, the configuration UI stays stable. New configuration features are written in AngularJS. New analysis features are written in React. The team has to maintain both.
Admin fields map almost one-to-one onto table columns. That makes the model easy to learn, and it means a schema change usually requires an admin UI change.
5.7 Database as the integration bus
The database is not passive storage. Components cooperate by table contract: writers guarantee field meaning and the time basis, readers parse that contract. A renamed field or a changed type is a breaking change across components.
Every database uses utf8mb4, utf8mb4_unicode_ci, and InnoDB. Names follow myems_{function}_db, tbl_{entity}, lower_snake_case columns, and tbl_{table}_index_{n}. When data is assembled across databases, names and meanings are predictable.
5.8 Contracts between components
- Time. All timestamps are UTC. Historical tables use
utc_date_time. Aggregate tables usestart_datetime_utcas the start of the period. Presentation converts to local time. Day and month boundaries are therefore UTC. If the business needs a local calendar, the report has to correct it. - Numbers.
DECIMAL(21,6)holds six decimal places, which covers typical kWh, m³, currency, and kgCO2e values without binary floating-point drift. - Identity. Entity tables have
id(BIGINT auto-increment) anduuid(CHAR(36)).idis the in-database link.uuidaligns objects across systems and across import/export, so auto-increment keys do not collide between environments. - Quality and status.
is_bad,is_published,is_counted, andis_enabledcontrol trust, publication, whether the value is counted, and whether configuration is enabled. Message tables use astatusstring such asnew→sent→acknowledged.
6 Data architecture
6.1 Data layers
| Layer | Content | Where |
|---|---|---|
| L0 raw points | The only source of measurements, append-only except for cleaning corrections | Historical database |
| L1 normalized energy | Rolled up to a meter, with category and unit | tbl_energy_value in the historical database |
| L2 dimensional aggregates | Materialized by object, direction, classification, and grain. This is what reports read | Energy database |
| L3 derived accounting | L2 multiplied by a factor, or produced by an algorithm | Billing, carbon, baseline, plan, prediction, and model databases |
The layers exist so a recalculation can be bounded. A factor change reruns L3. A wrong meter binding reruns from L1. Only a collection error goes back to L0. Knowing the boundary keeps a factor correction to hours rather than a full rebuild.
6.2 Database split
The 13 databases fall into four groups: configuration (system, user), raw (historical), aggregates (energy, billing, carbon), and derived or supporting (baseline, model, plan, prediction, fdd, reporting, production).
| Database | Purpose | Scale | Main writers | Main readers |
|---|---|---|---|---|
| myems_system_db | Categories, items, spaces, meters, equipment, combined equipment, points, data sources, cost centers, tariffs, distribution systems, energy-flow diagrams, commands, control modes | Most tables (about 150), small volume, complex relations | Admin UI through the API | Collectors, computation, API |
| myems_historical_db | Raw series, latest-value cache, and file tables for offline meters, cost, repair, and plans | Largest, grows with points and timestamps | Collectors, import | Normalization, API real-time analysis |
| myems_energy_db | Multi-dimensional energy at hour/day/month/year | Rows depend on objects and dimensions | Aggregation | API reports |
| myems_billing_db | Cost aggregates, same shape as energy, already priced | Same | Aggregation | API cost reports |
| myems_carbon_db | Carbon aggregates, same shape, already factored | Same | Aggregation | API carbon reports |
| myems_energy_baseline_db | Baselines for savings comparison | Small | Aggregation / import | API analysis |
| myems_energy_model_db | 8,760-hour annual model | 8,760 rows per object | Aggregation / generation | API forecast and budget |
| myems_energy_plan_db | Plans and targets | Small | Plan-file import | API comparison |
| myems_energy_prediction_db | Predicted energy | Small | Prediction jobs | API |
| myems_fdd_db | Fault rules and web, email, SMS, and WeChat messages | Small, complex rule expressions | Rule engine, API | API, message delivery |
| myems_user_db | Users, privileges, sessions, API keys, audit logs, notifications | Small, high security | API | API authentication |
| myems_reporting_db | Report definitions, templates, generated files, email | Small, includes binary attachments | Report jobs | API |
| myems_production_db | Products, teams, shifts, and output, for energy per product | Small | Admin UI, import | API intensity analysis |
6.3 Domain model
The core is an ownership chain. A data source produces points. A point belongs to a meter or equipment. A meter belongs to a space and binds an energy category. Spaces form a tree through the parent pointer, and stores, tenants, and shopfloors hang on that tree. Combined equipment groups equipment and meters into one system. Dictionaries (category, item, cost center, tariff, product, contact) are referenced by foreign key.
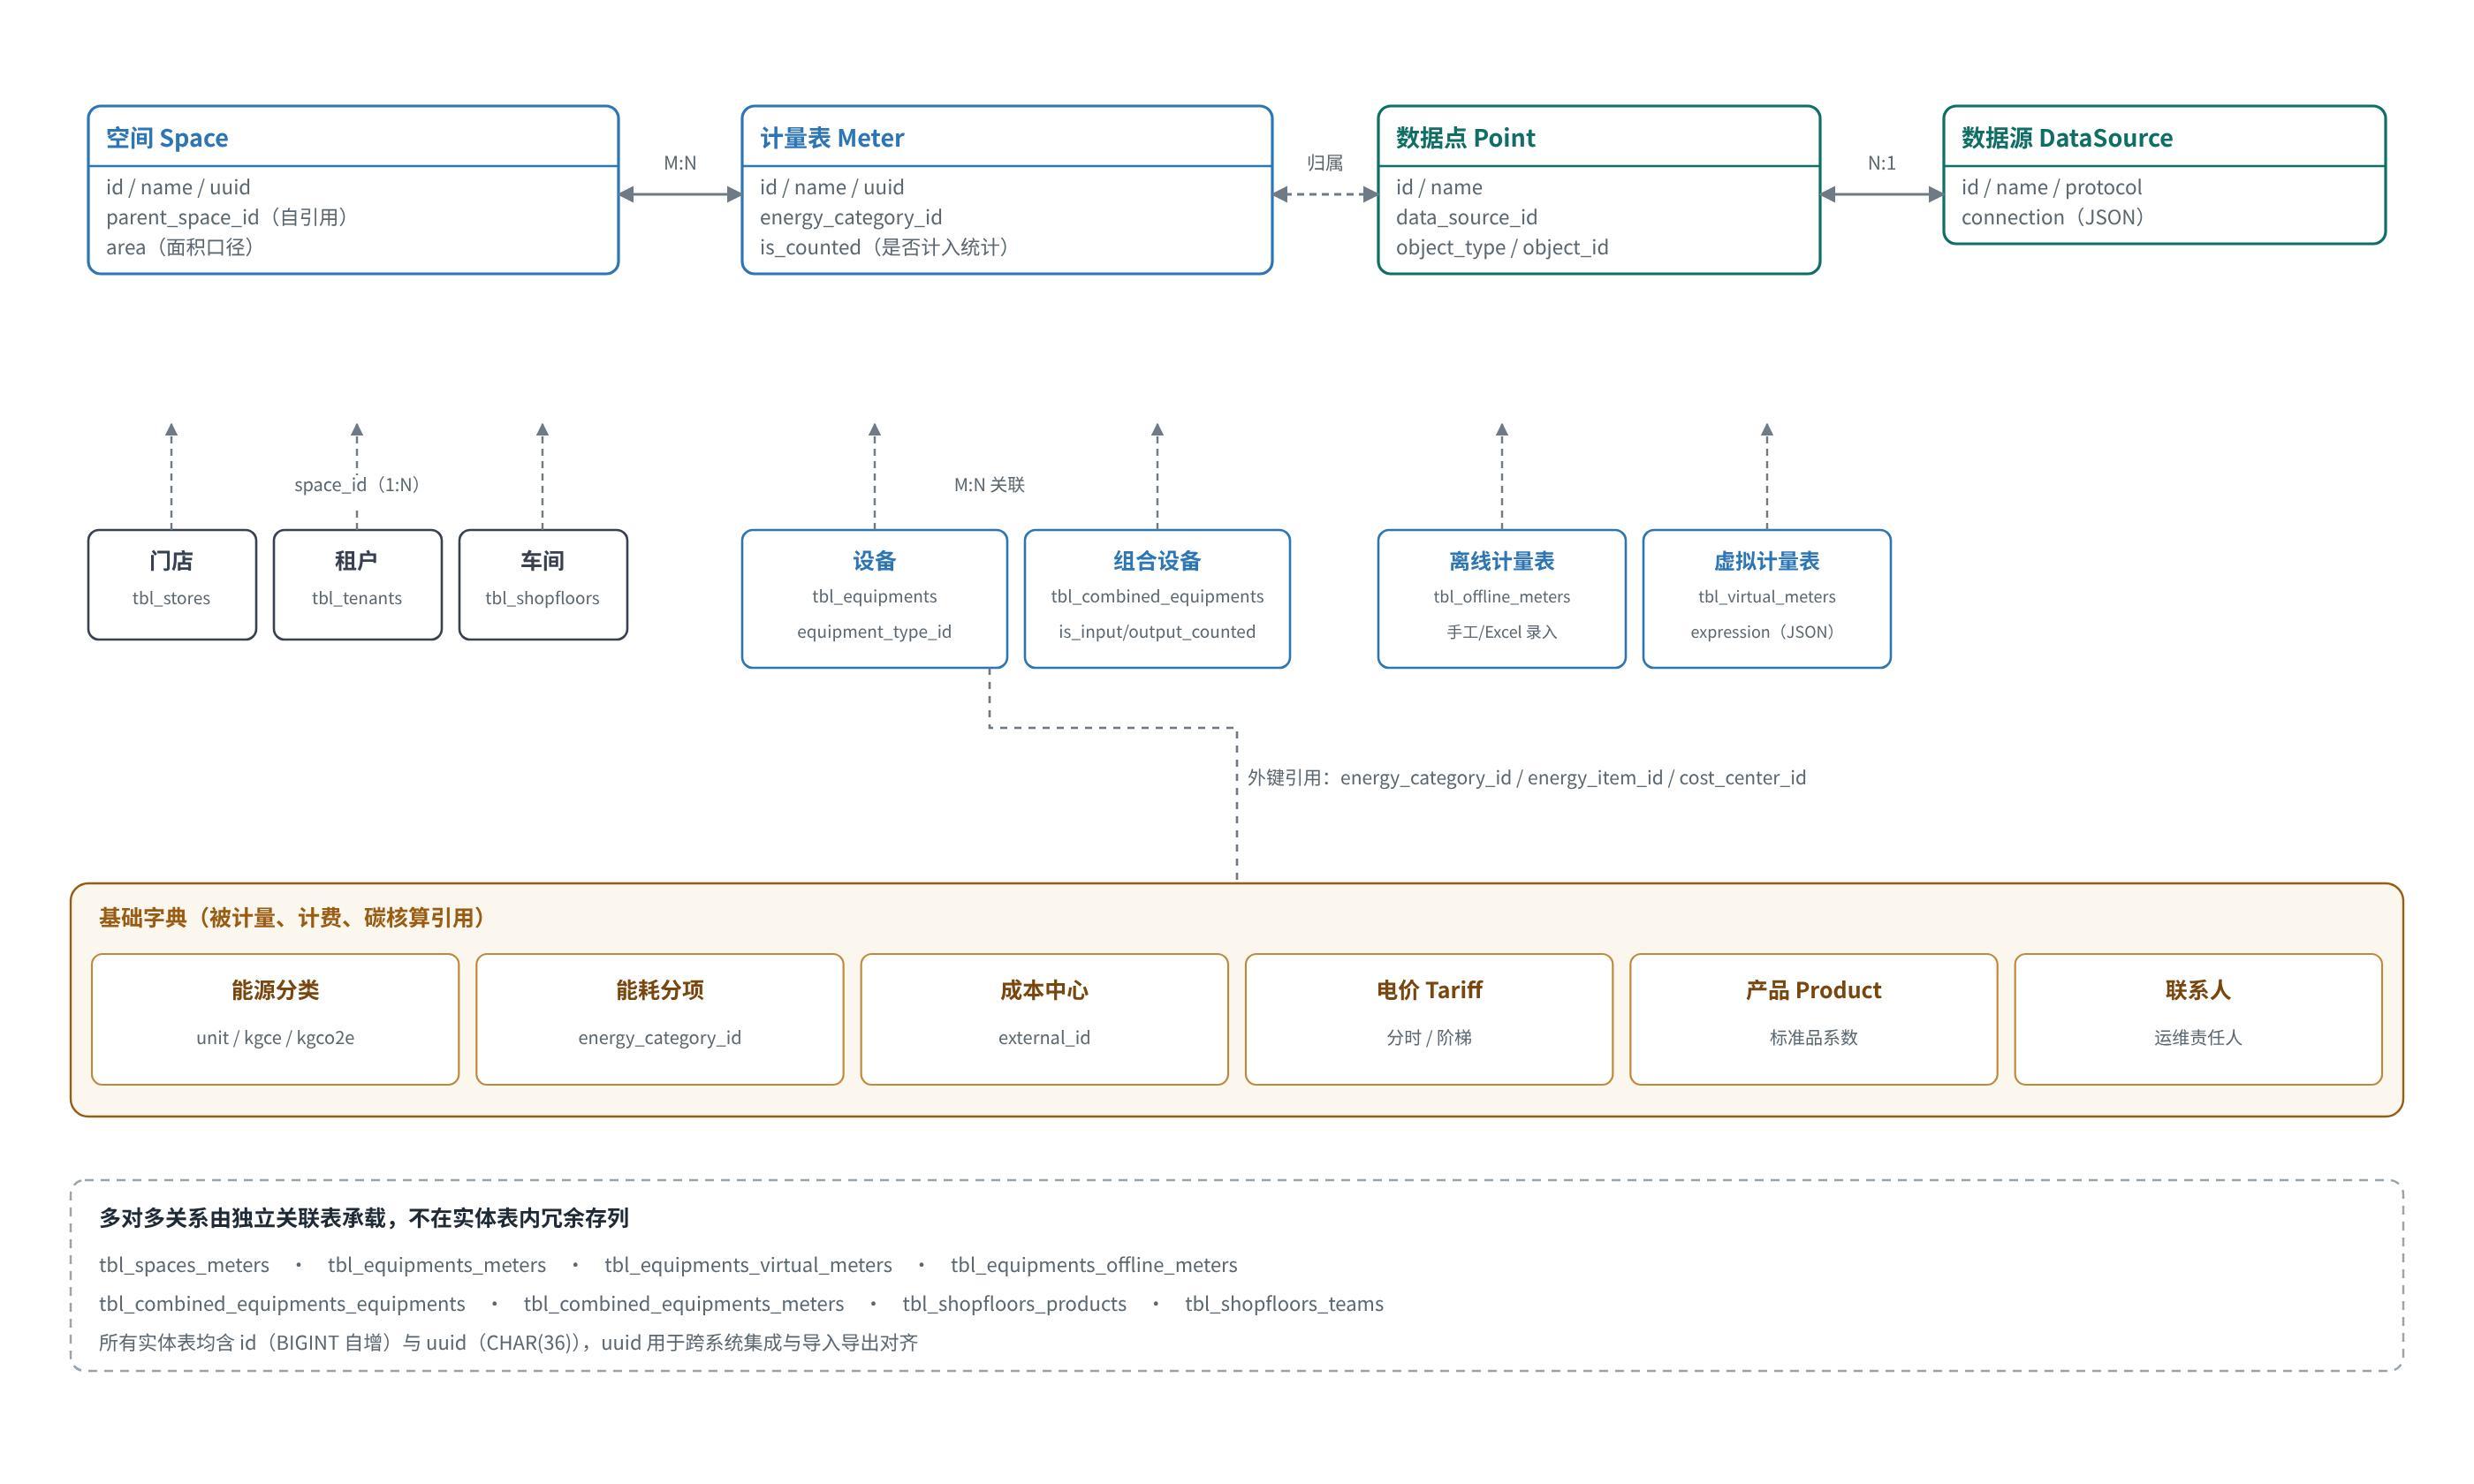
Two common shortcuts are deliberately avoided. Association columns are not duplicated onto entity tables. Many-to-many links live in their own tables (tbl_spaces_meters, tbl_equipments_meters), so one meter can serve several space views. There is also no separate fact-table family per object type. One naming rule is reused, so report logic can be parameterized by object type.
The cost is multi-hop queries. “Lighting electricity of this floor this month” needs a space-tree walk, an association-table expansion, and an energy-item filter. That is why the system pre-aggregates instead of joining at request time.
6.4 Time-series tables
The four historical value tables (analog, digital, energy, text) share point_id + utc_date_time + actual_value, plus is_bad and is_published. Each has a _latest table so real-time pages and equipment status do not run MAX over a table of tens of millions of rows.
Indexes are the composite (point_id, utc_date_time) and the single column (utc_date_time). The first serves “this point in this range”. The second serves “every point in this range” for batch jobs. The pair matches the two access patterns: online query and offline computation.
Files (offline-meter files, cost files, repair files, plan files, report files, and templates) are stored as LONGBLOB, with file_name, uuid, upload_datetime_utc, and status. Backup and migration then only have to move the database. The database grows with attachments, so a project should set a file-size limit and a cleanup policy.
6.5 Aggregate table names
Tables are named tbl_{object}_{direction}_{classification}_{grain}.
- Object:
meter,offline_meter,virtual_meter,equipment,combined_equipment,space,store,tenant,shopfloor - Direction:
input,output - Classification:
category(energy category),item(energy item) - Grain:
hourly,daily,monthly,yearly
| Object | Direction and classification | Example |
|---|---|---|
| Meter | none | tbl_meter_hourly |
| Offline / virtual meter | none | tbl_virtual_meter_hourly |
| Equipment | input or output / category or item | tbl_equipment_input_category_hourly |
| Combined equipment | input or output / category or item | tbl_combined_equipment_output_item_hourly |
| Space | input or output / category or item | tbl_space_input_category_daily |
| Store / tenant / shopfloor | input / category or item | tbl_tenant_input_item_monthly |
| PV / storage / microgrid | charge, discharge, grid buy, grid sell | tbl_energy_storage_container_charge_hourly |
The physical schema is a subset of that cross product, not the full matrix. Seeing the name is enough to infer the dimensions, and a new object can follow the same rule.
6.6 Accounting basis
Coal equivalent, money, and carbon dioxide all start from the same energy value. Only the coefficient changes. tbl_energy_categories.kgce and kgco2e hold the factors. Tariffs hold the cost coefficient.
The seeded example for electricity is 0.123 kgce/kWh and 0.928 kgCO2e/kWh. Those numbers are examples. A project must replace them with the local statistical basis, the grid emission factor, and the contract tariff. Otherwise every carbon and cost report is systematically wrong. A basis change should be recorded as a configuration change plus a period rerun, not as an edit of historical values.
Time-of-use and tiered tariffs are interpreted during aggregation. Carbon factors can differ by energy category, but there is no factor-version table. History after a factor change depends on a rerun.
6.7 Capacity and retention
The raw time-series database is the only one that grows linearly with point count and sample rate. At 3,000 points and a 15-minute interval, that is about 288,000 rows per day and about 105 million rows per year. At about 40 bytes per row including indexes, that is about 3.9 GiB per year. A 1-minute interval multiplies the growth by 15, and then time partitioning or archival is required. (Estimate.)
Aggregate databases grow with object count and dimension combinations, not with point count. At 500 objects, 4 grains, and 2 classifications, one dimension is about 4.38 million hourly rows per year, which is manageable. Scaling pressure comes from collection, not from reports. (Estimate.)
Suggested retention: keep raw values for the shortest period that still allows audit and recalculation (often 1 to 3 years), keep aggregates and derived values long term, and clean files on a project schedule. There is no built-in archival job. Cleanup has to be a database job, and the recalculation window must be confirmed before data is removed.
7 Data flow
7.1 End-to-end path
A value passes seven stages from the field to a report: field read, protocol parse, raw insert, normalization, cleaning, aggregation, and query (Figure 2). Each stage has explicit input and output tables and aligns on a time range, so any stage can be rerun on its own.
The cadences differ. Collection is on the order of minutes, normalization, cleaning, and aggregation are hourly, and reports are request-scoped. A report usually lags by one period. That lag is by design. Training should say so, so it is not treated as “the live data is wrong”.
7.2 Collection and raw insert
The collector wakes on the data-source interval, reads each point, writes the historical database, and refreshes _latest. The key is point plus timestamp. Whether a second write of the same timestamp is idempotent depends on the implementation. Operationally, one point should be owned by one collector, so two writers do not collide on the same point and timestamp.
7.3 Normalization and cleaning
Normalization reads raw values for an hour, applies the meter-to-point binding, and writes the energy-value table. Cleaning follows and handles out-of-range, missing, and backwards values. The order must not be reversed. Values have to be rolled up to a meter before “is this abnormal for this meter” can be judged.
7.4 Aggregation and derived values
Aggregation does three things from one energy read: energy by object and dimension, cost by tariff, and carbon by factor. The three writes keep the three databases consistent for that period. Baselines, plans, predictions, and the 8760 model are produced afterwards from historical aggregates. They are a second derivation.
7.5 Query path
nginx forwards the request to the API. After authentication, configuration is read from the system database, live values from _latest, and reports from the aggregate databases. Excel is streamed from the server and is not written to disk.
The performance rule is: never do heavy calculation during the request. Report pages are fast because they read materialized tables. A question outside the prepared dimensions (an arbitrary window crossed with an arbitrary combination) falls back to scanning the historical database and should be estimated before it is promised.
7.6 Faults and recalculation
Anomalies are flagged, not dropped. Mistakes are repaired by rerunning a range, not by rebuilding the database. A wrong coefficient reruns the derived layer. A wrong binding reruns the normalized layer. A collection gap is backfilled at the raw layer and then rerun upward (see 6.1).
During a rerun, is_published should hide half-finished values. That control is manual. There is no single recalculation console, and this is one of the more operationally expensive parts of the system.
8 Interface design
8.1 Style
The API is REST. Resources are plural nouns, hierarchy is path nesting, and non-CRUD actions are verbs on a sub-path. Responses are JSON. List endpoints do not offer a complex query language. Filters are path parameters and a few query parameters. That is easy for scripts and third-party systems, and it is weak for complex search.
Every configuration object has /export and /import. Export is JSON of the full topology (a combined equipment export includes its equipment, meters, offline meters, virtual meters, parameters, and commands). Import aligns objects by uuid. That is how configuration moves between environments and how a standard configuration is copied across projects.
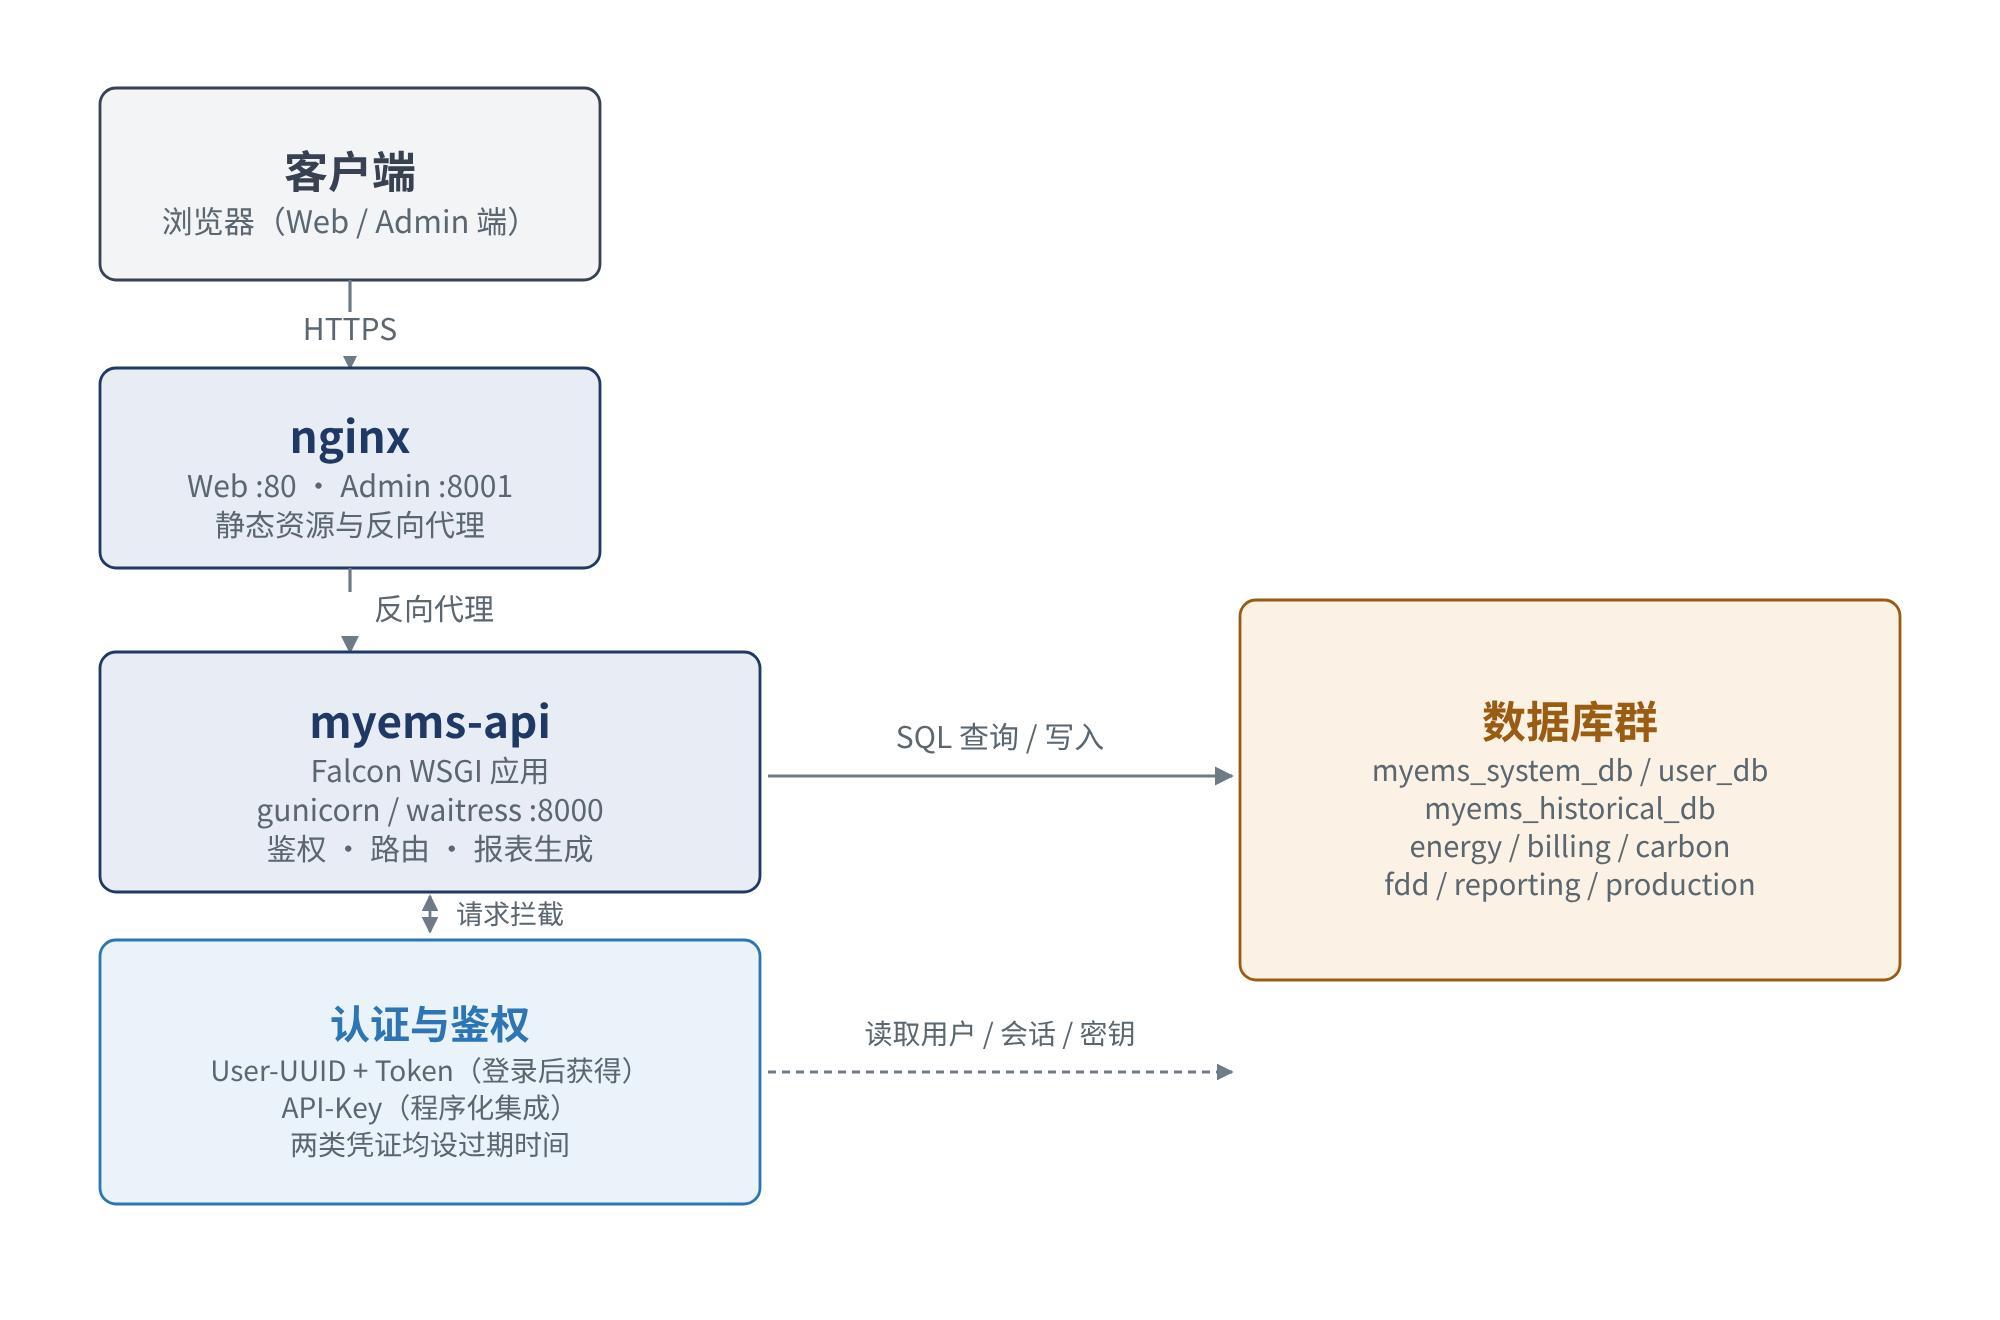
Figure 4 shows the path from the client through the reverse proxy into the service and the database, and where authentication sits.
8.2 Authentication and authorization
Every request carries User-UUID and Token headers. The token is issued at login and expires. Programmatic clients may send API-Key instead. That key also expires. The API checks the credentials and returns 401 on failure. API-Key and Token can also be used together when several systems share one account.
Privileges are per user. The user row has is_admin, is_read_only, and privilege_id. The privilege body is JSON in tbl_privileges. The three levels are administrator, read-only, and custom. There is no organization-level row filter. Multi-tenant isolation is the space tree and views, not a separate database.
8.3 Resource groups
- Configuration: spaces, meters, equipment, combined equipment, points, data sources, cost centers, tariffs, contacts, commands, control modes
- Energy data: analysis endpoints and live values
- Reports: advanced-report definitions, runs, and templates
- System: users, privileges, version, notifications
- Production: products, teams, shifts, output
A resource usually maps to one main table plus association tables. Integrators have to create the object and then bind the relationships. Skipping the bind step is a common miss.
8.4 Reports and export
Page reports are rendered by the front end from analysis endpoints and exported to xlsx by the API. Advanced reports are driven by a definition, a template file, a schedule, and email, and the generated file is stored in the reporting database. Both read the same aggregates. One is for looking now. The other is for periodic submission.
8.5 Integration guidance
- Create a read-only account and a separate API key for each third party. Do not share the administrator key.
- Rate-limit and control access at nginx. The API does not rate-limit itself.
- Prefer aggregate endpoints and report export for bulk reads. Do not scan long ranges through the live-value API.
For a group platform, the smallest useful dataset is daily aggregates plus the space tree. That matches a management view and keeps the call volume predictable.
9 Deployment
9.1 Units and ports
There are two installation paths. docker-compose starts every component and is the fast path. A native install runs each Python service under systemd and fits offline sites or tighter control. The component set is the same. Only process management differs.
| Unit | Default port | Exposure | Notes |
|---|---|---|---|
| myems-web (nginx) | 80 | Public | Static files and reverse proxy to the API |
| myems-admin (nginx) | 8001 | Internal or VPN | Static files and reverse proxy to the API |
| myems-api | 8000 | Internal | REST, reached by nginx and internal callers |
| MySQL | 3306 | Internal | 13 databases. Do not expose to the public network |
| Collectors (4) | none | — | Must reach the field network (port 502 and others) |
| Computation (3) | none | — | Must reach the database only |
9.2 Typical single-host topology
A typical deployment has three parts: an application host with all containers and the shared volume, a data host with the database, and a field network with instruments and controllers. The application host exposes 80 and 8001. Ports 8000 and 3306 stay on the internal network. Collector containers also need a route to the field subnet.
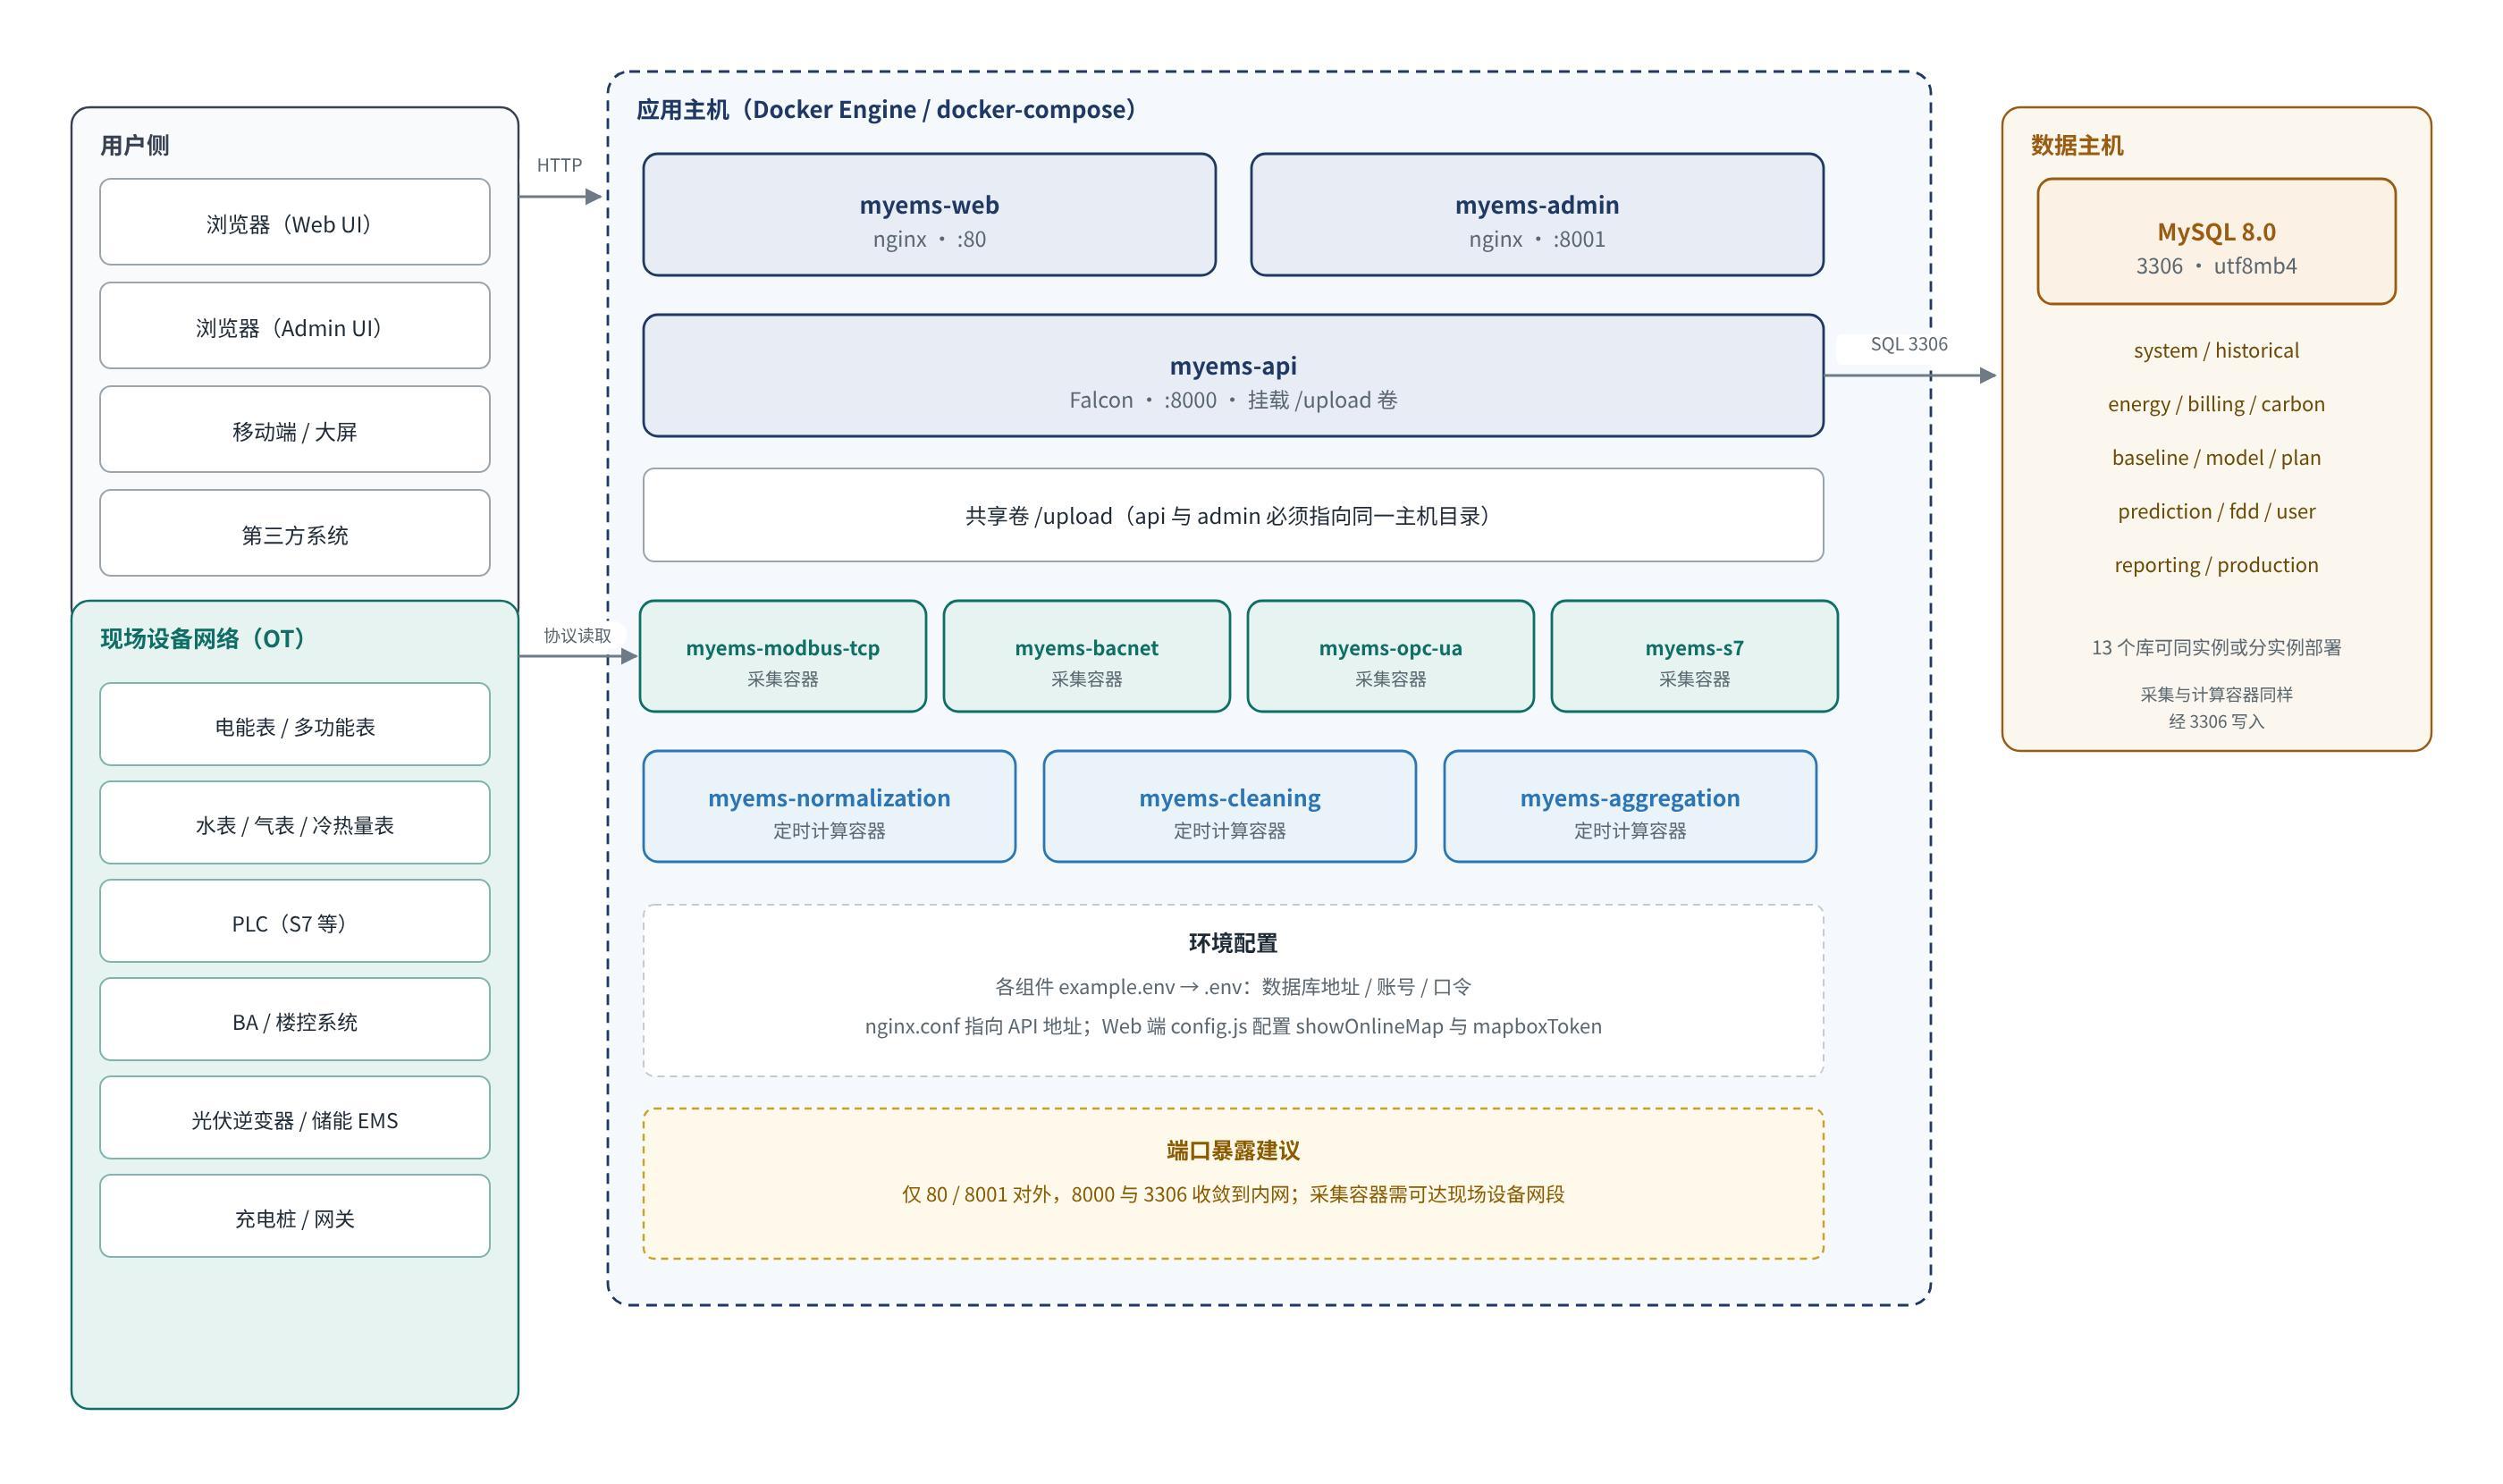
The shared /upload volume is easy to miss. api and admin must mount the same host directory. Otherwise a template uploaded in the admin UI is invisible to the API, and report generation fails because the template is missing. In containers, the volume source path of the two services must be identical.
9.3 Field network
Collection is the only component that must reach the OT network. Prefer two NICs or a dedicated collection gateway: one side on the IT network toward the database, the other on the OT network toward devices, with no routing between them. If only one NIC is possible, switch ACLs should limit the collector to registered instrument addresses and ports.
Serial-only meters need a Modbus RTU-to-TCP gateway on site, which myems-modbus-tcp then reads. The gateway’s connection limit and timeouts directly affect the collection interval and are a common bottleneck.
9.4 Configuration that must be right
- Each component’s
.env(database host, account, and password, copied fromexample.env) nginx.conf(API address, one file for web and one for admin)- Web
src/config.js(showOnlineMapandmapboxToken; turn the online map off when offline) - The upload volume path in docker-compose (Windows and Linux path syntax differ)
Misconfiguration is the main deployment failure, and the symptoms mislead. A wrong database address makes the API exit on startup. A wrong nginx configuration opens the page with empty data. After deployment, check in this order: API /version, login, open any analysis page, confirm one collected value.
9.5 Scaling out
Scale by workload. Collectors can be split by subnet or protocol. Each instance reads the same data-source configuration and owns a subset of sources. The API can run as several instances behind nginx, sharing one database. Computation usually does not need more than one instance. The bottleneck is database writes, not CPU.
On the database side, MySQL read replicas can take query load, and the historical database can be its own instance so collection writes do not compete with reports. The application does not implement read/write splitting. That has to be added in the API connection configuration. It is an extension, not a built-in feature.
10 Non-functional design
10.1 Performance
The strategy is to move calculation into the batch. A report request filters and sums. It does not aggregate across large tables, so response time depends on the selected period and object count more than on total data volume. Live pages read _latest and avoid the historical table.
Three likely bottlenecks, inferred from structure and not measured in production:
- Historical writes. At tens of thousands of points, a single table becomes the bottleneck and needs to be split by point or by database.
- Aggregation. An hourly job that runs longer than an hour accumulates lag.
- Excel export. Large exports build chart objects in the API process, and memory grows with the report.
Measure row growth and job duration during trial operation before treating any number as a capacity limit.
10.2 Reliability
Processes are stateless or weakly stateful. A crash is recovered by restart. A missed collection cycle is filled by the next one. A failed calculation is rerun for that range. Durability is the database’s transactions and backups. There is no cross-database transaction, so the databases can be briefly inconsistent with each other.
The single host has an obvious single point: the database. Containers isolate components. They do not make the database highly available. Projects that need continuity should use replication or a cluster and point the application at the writable node.
10.3 Security
Built in: passwords are salt plus hash, never plaintext; accounts and passwords can expire; failed logins are counted; API keys and tokens expire; critical operations are written to the audit log with method, resource type, resource id, and request body.
The project still has to close these gaps:
- Change the default password
administrator/!MyEMS1at first login - Rate-limit at nginx. The API does not
- Terminate TLS at the reverse proxy
- Grant the application account the minimum privileges. It should not have DDL
The audit log and quality flags are a basic trail. They are not a full graded-protection package: there is no mandated log retention, no second factor, and no data masking. Regulated or classified deployments need extra hardening.
10.4 Operations
Most runtime parameters live in the database or in .env, so a database backup is also a configuration backup. Logs are single files (myems-*.log). What is missing is a job orchestrator and a health endpoint. Collector and computation health has to be inferred from data growth and logs.
Three monitors cover the silent failures:
- Collection continuity: last write time per point
- Aggregation freshness: latest period at each grain
- API health:
/versionand the latency of key queries
10.5 Languages and organizations
The front end uses i18next. The repository README is published in more than twenty languages. The backend stores names as UTF-8, and the UI language comes from front-end resources. Multiple organizations are a space tree plus store, tenant, and shopfloor subtypes: logical isolation inside one instance, not a separate instance or database.
That is enough for a small number of projects. At group scale, privileges stop at the user. A user cannot be limited to one subsidiary, and every project shares the aggregate tables, so row counts grow linearly with the number of projects.
11 Decisions and trade-offs
| Decision | Choice | Why | Cost and response |
|---|---|---|---|
| Data placement | 13 databases by purpose | Separates collection writes, aggregate growth, and configuration reads. Each database can scale alone | No cross-database JOIN. The application associates rows |
| Aggregation | Materialize object × direction × classification × grain | Storage buys response time. Report pages do not aggregate live | A new dimension needs new tables |
| Integration | Database tables as the bus. No message broker | Simple, offline-capable, no extra component to operate | No event sourcing or replay |
| Time basis | UTC everywhere | Time zones and cross-database comparison stay unambiguous. Daylight saving is handled in presentation | Day and month edges are UTC, not the local calendar |
| Collection | Periodic polling, interval per data source | Works with existing meters and old PLCs. No device-side change | Freshness is limited by the interval |
| Front ends | React for analysis, AngularJS 1.x for configuration | The analysis UI can move. The configuration UI stays stable | Two stacks to maintain |
| Databases | MySQL family and several domestic databases | Fits private and information-innovation deployments | Only the shared SQL subset. Vendor features are unavailable |
| Deployment | Single-host docker-compose first | Low delivery cost for project work | High availability and read/write splitting are designed per project |
In one sentence: MyEMS trades limited real-time behavior and limited horizontal scale for a simple structure that is light to deploy, and it trades recalculation cost for precomputation. A review should confirm that the project accepts both exchanges.
12 Extension guide
12.1 A new collection protocol
Copy the collector skeleton, using myems-modbus-tcp as the template. Keep the loop: read configuration, connect, collect, write, update latest. Replace protocol handling and address parsing. Register the protocol name, add the admin form, then add the container and the systemd unit.
Three easy mistakes: address parsing must tolerate a bad point without aborting the cycle; writes must follow the existing tables and UTC or normalization will not see the data; follow the existing “restart after configuration change” rule instead of a half-implemented hot reload.
12.2 A new analysis report
The smallest change is an API resource plus a front-end page. The resource queries existing aggregate tables. The web app adds a route and charts. If the report must be sent on a schedule, configure an advanced report instead: a JSON expression for the scope, a template file, and the report job for generation and email.
Stay inside existing dimensions. A free combination of arbitrary window, arbitrary objects, and arbitrary items needs a new materialized table or a separate analytical database. Do not scan the historical database during the request.
12.3 A new energy type
This is the cheapest extension. Add a row to the energy-category table with the unit, kgce, and kgCO2e, then create meters and bind points. Aggregate tables are organized by category, so a new energy type does not need its own tables.
Two cautions: maintain factors for the project location, do not keep the sample values; if the new type needs a unit conversion (steam by mass and enthalpy, for example), do that conversion in collection or normalization, not inside individual reports.
12.4 A new business object
This is the most expensive extension. An example is a new kind of functional zone in a campus. It needs an entity table, association tables, an aggregate-table family, a branch in aggregation, an API resource, and screens in both front ends. That is a version-level piece of work, not comparable to adding an energy type.
Add an object type only when it has its own accounting basis and its own privilege requirement. If it is only another grouping of the same meters, use the space tree or an association table.
13 Risks and suggested direction
These are assessments from public material and from the structure. They are not a project roadmap.
- Two front-end stacks. AngularJS 1.x is no longer supported. Security patches and browser compatibility on the configuration UI will narrow. Prefer new configuration features on React, and treat a gradual migration of the admin UI as a longer-term goal.
- A ceiling on freshness. Polling plus hourly calculation sets the real-time limit. Second-level or minute-level closed-loop control needs a separate channel, such as MQTT or a time-series database, not a rewrite of this path.
- Aggregate growth and the recalculation window. More objects mean more tables and more rows, and a full rerun can exceed the schedule. Prefer time partitioning and incremental recomputation.
- Database as a single point, and weak tenant isolation. Hosting many projects together makes the database a single point, and privileges stop at the user. At group scale, deploy one instance per project, or add a metadata service that filters rows.
- Default security and API governance. The default password, the lack of rate limiting, and the lack of built-in TLS are delivery gaps. Put them on the implementation checklist so they do not depend on individual experience.
- No archival. Raw history grows without a built-in archive policy. Add an archive job on the project side, and decide the recalculation window and the audit requirement before archiving.
Appendix A. Default ports and initial account
Community Edition defaults, for the first deployment check only. Change the password at first login, and reduce exposure as described in section 10.3.
| Item | Default | Notes |
|---|---|---|
| Web UI | 80 | Analysis entry |
| API | 8000 | REST service |
| Admin UI | 8001 | Configuration entry |
| Database | 3306 | MySQL default |
| Admin account | administrator / !MyEMS1 | Must be changed at first login |
| Web account | administrator / !MyEMS1 | Shares the user table with the analysis UI |
Appendix B. Component read/write matrix
Logical access, useful for privilege design and backup scope. “Write” means the component can change business tables in that database. Actual accounts should be narrowed to the minimum required.
| Component | system | historical | energy | billing | carbon | user | reporting |
|---|---|---|---|---|---|---|---|
| Collectors | read | write | — | — | — | — | — |
| Normalization | read | read/write | — | — | — | — | — |
| Cleaning | read | read/write | — | — | — | — | — |
| Aggregation | read | read | write | write | write | — | — |
| API | read/write | read/write | read/write | read | read | read/write | read/write |
| Report jobs | read | read | read | read | read | — | write |