MyEMS White Paper
Download: MyEMS开源能源管理系统白皮书.pdf
| Item | Content |
|---|---|
| Document | MyEMS Open-Source Energy Management System White Paper |
| Subtitle | An energy and carbon accounting base built on metering relationships |
| Version | 6.10.0 |
| Date | October 2026 |
| Prepared by | Beijing Haisoft Software Co., Ltd. (https://hassoft.cn) |
| Community | https://myems.cn |
This white paper is based on public material, the MyEMS architecture design document, and the source repository. Official statements, documented facts, and the author's estimates are graded separately. Assumptions are stated in the text. The Chinese original is the document of record; this page is the English rendering.
Executive summary
The constraint has moved from tonnes of coal equivalent to tonnes of CO2 equivalent. Guo Ban Fa [2024] No. 39 makes carbon intensity the binding indicator for the 15th Five-Year Plan period. In March 2025 the national carbon market expanded to steel, cement, and aluminum smelting, adding about 1,500 key emitters and about 3 billion tonnes of CO2 equivalent, with monthly evidence retention and a three-level data review. Energy, cost, and carbon are now asked for by the same regime.
Most organizations do not lack a system. They lack accounting. A dashboard can show a live curve and still cannot say which meter belongs to whom, who is charged for a period of consumption, which factor was used, or how a mistake is corrected. This paper reduces that gap to six tests: object model, point binding, data quality, basis changes, multi-dimensional aggregation, and portability. Fail three or more, and the system is only a monitor.
MyEMS answers with seven object types sharing one set of aggregates, three accounting chains sharing one energy value, and thirteen databases split by purpose. A shared database and precomputation buy a light deployment, offline operation, and results that can be recomputed. Fixed dimensions buy consistency across projects. The system is for deep accounting on a daily and monthly cycle inside one project. Second-level closed-loop control and trade-settlement metrology belong to specialist systems.
The same structure states the costs. Reports lag by one period, and queries scan narrow tables. A new dimension needs a new materialized table, and one configuration can then be reused. Two front-end stacks and multi-database compatibility cost maintenance, and they buy delivery across databases and domestic database products. Writing the eight technical decisions into the project charter reduces failure more than ticking a feature list.
The money is not in the software. In the worked example, a 1 million CNY project spends about 40% on metering retrofit and about 35% on implementation. At 17 million CNY of annual electricity cost and a 3% to 8% saving rate, the simple payback is 2.1 to 0.8 years. Success depends on three things: meters in place, a frozen accounting basis, and someone who actually takes the system over. (Estimate.)
Chapter 1. About this paper
What this paper answers
Chinese material on MyEMS is already plentiful: the website lists Community and Enterprise features, the repository README describes components and deployment, and the architecture document specifies 11 components, 13 databases, and the contracts between them. A complete set of materials is not the same as an easy decision. A project that is about to start needs to know how those capabilities map onto its own accounts, and which limits it must accept.
Four questions organize the paper: what changed in the policy environment; why sites that already have live curves still cannot allocate cost or match bills; which structure MyEMS uses, and what it asks the user to give up; and how a project moves from a metering retrofit to an acceptable report, including cost and benefit.
Chapters 1 to 3 set the background. Chapters 4 to 7 describe the product and its costs. Chapters 8 to 10 cover implementation, money, and selection. Chapter 11 closes with risk and a conclusion. The product is not introduced first, because a feature list is hard to judge without the policy constraint and the accounting problem.
Evidence grades
| Grade | Source | Use in this paper | Boundary |
|---|---|---|---|
| Documented fact | Architecture design document, v6.9.0, October 2026 | Components, databases, API contracts, deployment parameters | Describes code structure, not a production benchmark |
| Policy text | Guo Ban Fa [2024] No. 39, and the ministry expansion plan | Regulatory context | Only published text |
| Official statement | Website feature lists, edition comparison, Gitee pages | Scope, release cadence, license, cases, certification | Published by the maintainer, not independently verified |
| Author's estimate | Performance judgments, cost model, scenarios | A decision range | Assumptions must be replaced with project quotes |
Documented facts can be checked against code. Official statements can show that a capability or a case exists. They cannot be turned into a success rate. Estimates change when the assumptions change. Mixing the grades is how an official claim gets treated as a technical fact, or an estimate gets treated as a policy requirement.
Baseline, date, and scope
The baseline is Community Edition v6.9.0. The project ships one minor version a month and one major version a year, 49 releases in total. Fields and ports in this paper follow the architecture document. Implementation should recheck the schema scripts and the upgrade notes for the version actually installed.
Capacity figures are order-of-magnitude derivations from table shape, sample interval, and schedule. They are enough to see whether pressure sits on collection or on reports. A performance commitment should be calibrated during trial operation.
Policy is current as of October 2026. Later expansion to chemicals, petrochemicals, civil aviation, and paper is still in preparation. This paper does not evaluate the energy saving of any real project. Chapter 9 is a method and a scenario calculator, not a saving rate to copy.
Position and disclaimer
MyEMS is developed and maintained by Beijing Haisoft Software Co., Ltd., which also sells the Enterprise Edition and project services. Technical facts here come mainly from the public architecture document and the website. Community and Enterprise capabilities are distinguished where the difference is commercial. The paper is usable because it also states where the product does not fit.
This paper is not a procurement recommendation, a technical warranty, or an evaluation of a third party. Comparisons use publicly checkable dimensions and do not include vendor prices. Trademarks, the code license, and ownership of modifications follow the MIT license text, the website statement, and the contract. Where this paper disagrees with source code or official docs, the source and the official docs prevail.
How to read it
Decision makers can read chapters 1, 2, 3, 9, and 10. Technical leads should read chapters 4 to 7. Implementation and operations should read chapters 5, 6, 8, and 9. Developers extending the system should read chapters 5, 6, and 10, then the component notes and the API manual.
Chapter 2. Policy and operating constraints
From energy intensity to carbon
In September 2020 China announced a CO2 peak before 2030 and an effort toward carbon neutrality before 2060. On 30 July 2024 the General Office of the State Council issued the work plan for a dual-control system on carbon emissions (Guo Ban Fa [2024] No. 39). For the 15th Five-Year Plan period, the reduction of carbon intensity is the binding indicator. Energy intensity is no longer the binding indicator.
Coal equivalent is a fixed factor by fuel. Carbon has to separate direct and indirect emissions, allow the grid factor to change by year, and attribute purchased electricity, purchased heat, fuel combustion, and process emissions. The same kilowatt-hour is one curve under an energy basis and three traceable pieces under a carbon basis: quantity, factor, and ownership. The plan also requires metering instruments and calibration. Without credible sub-meters, a carbon report is only a proportional split of the main meter.
The carbon market prices data quality
The national emissions-trading market opened with power generation in July 2021. In March 2025 steel, cement, and aluminum smelting were added: about 1,500 new key emitters and about 3 billion tonnes of CO2 equivalent, so that more than 60% of national CO2 emissions are covered. 2024–2026 is the start-up stage. From 2027 the market is to deepen, with a goal of covering the main industrial sectors by 2027.
By 30 June 2025 cumulative allowance volume was 669 million tonnes and value was 45.93 billion CNY. Full-year 2024 value was 18.044 billion CNY. Allowances are allocated by intensity. A calculation error is then a profit-and-loss error, not a report error. Monthly evidence retention and a national–provincial–municipal review require data that can be sealed by month, traced to the raw meter, and shown not to have been edited afterwards.
The three new sectors regulate direct emissions from fossil combustion and industrial processes, not indirect emissions from purchased electricity and heat. Corporate carbon management, green-factory assessment, and product footprints still need the indirect figures, and green power or green certificates change that algorithm. A system has to keep both bases.
Structural pressure on energy cost
Time-of-use tariffs, demand charges, and power-factor penalties are not “quantity times a unit price”. Tenant allocation in a complex adds area, sub-meter, and contract rules that change with the lease. Rooftop PV, storage losses, and EV chargers add purchase, generation, export, and storage flows. Cost accounting then approaches a small energy balance.
What the management standard does and does not give
GB/T 23331-2020 is identical to ISO 50001:2018, published 19 November 2020 and effective 1 June 2021. It requires an energy review, a baseline, energy performance indicators, targets, an action plan, and measurement. It does not specify meter numbering, allocation audit trails, or how a baseline is recomputed. The system fills that gap. The object model decides whether “this chiller belongs to this plant, which serves these buildings, whose tenants share the cost” can be expressed. The accounting chain decides whether history can be rerun after a tariff change.
Five hard requirements
- Traceable. Every energy, cost, and carbon figure returns to a meter, a point, and a time range.
- Accountable. Three chains share one energy value. Factors can be replaced. History can be rerun by period.
- Comparable. Year-on-year, period-on-period, baseline comparison, intensity per area and per product, and main/sub-meter balance.
- Auditable. Bad data is flagged, not silently overwritten. A basis change is recorded, not painted over history.
- Operable. The system runs on an enterprise network, offline, and on domestic hardware and software.
A live curve is the minimum of the first requirement. Allocation, evidence for a verification, and a rerun after a policy change are what the test actually measures.
Chapter 3. Structural gaps in current systems
A dashboard answers “how much now”. An accounting system answers “whose meter, who is charged, which factor, and how a mistake is corrected”. The modeling work of the second is several times the first.
Field devices are not from one vendor: Modbus RTU or TCP, BACnet/IP, Siemens S7, OPC UA, and RS485. Separate collectors use different clocks and point names. A crashed collector leaves a permanent gap that the report does not show. A real fix means a new protocol does not change analysis logic, and addresses and intervals are configured in the admin UI.
Visible features are curves and alarms. The invisible parts are the meter register, point-to-meter binding, categories and items, allocation rules, tariffs, baselines, and plans. Small distortions accumulate: unexplained main/sub-meter differences, a meter replacement booked as negative consumption, history not rerun after a tariff change, a new workshop added as a report column instead of an object.
Commercial licenses often price by point, module, and concurrent user. Open source lowers the exit cost. It does not supply the people who bind the meters correctly.
One kilowatt-hour belongs to a circuit, a building, a tenant, a store, a shopfloor, and possibly a chiller plant. A space-only model cannot answer intensity, a tenant bill, or energy per ton of cooling. Auditability needs the raw series, a mark on every transformation, and a trace of configuration changes. Whether the owner's own engineers can add a data source, change a tariff, and rerun a period without the vendor is a more practical test than the feature list.
| Test | Typical monitoring system | Accounting system |
|---|---|---|
| Object model | Circuits and points. Hierarchy is a naming convention | Seven object types and many-to-many ownership |
| Point binding | A second mapping in the analysis tool | The point belongs to a meter or equipment. That binding is the source of truth |
| Data quality | Filtered or overwritten, no mark | Out of range, missing, and backwards values are flagged |
| Basis change | History or configuration is edited in place | Factors change, then the period is rerun, and the change is recorded |
| Aggregation | Space or circuit only. Allocation is done in Excel | Materialized by object, direction, classification, and grain |
| Portability | Tied to the vendor | JSON import/export, REST, and a standard database |
Three or more items in the middle column means the installed system is a monitor. Adding reports on top does not create traceability.
Chapter 4. Positioning, history, and open-source governance
MyEMS is an open-source energy management system aligned with GB/T 23331-2020 / ISO 50001:2018. It covers electricity, water, gas, cooling, and heat for buildings, factories, malls, hospitals, campuses, and energy-carbon centers, on three lines: energy, cost, and carbon. Official material cites more than a thousand project cases and CMA testing. The code is MIT-licensed. These case and certification claims are maintainer statements and are not independently verified here.
The product models metering relationships. It does not do deep SCADA graphics, legal metrology for trade settlement, a message bus, or a stream processor. Components exchange data through tables. Freshness is the collection interval.
The repository at v6.9.0 has 49 releases, 51 tags, and 6,138 commits. The Gitee page shows 2.7k stars, 890 forks, and 275 watchers. Python is 96.7% of the code. Upgrades must apply schema changes from the CHANGELOG. Collection is four services (Modbus TCP, BACnet/IP, S7, OPC UA) plus offline meters and Excel import. Computation is normalization, cleaning, and aggregation.
The MIT license allows commercial use, modification, redistribution, and closed derivatives. The Community Edition additionally requires the MyEMS copyright and logo to remain. Renaming the product is explicitly unsupported and is an Enterprise authorization. MIT grants no trademark right and no warranty. Community support is mainly QQ and WeChat groups, not a commercial SLA.
| Domain | Community Edition | Enterprise Edition (by project contract) |
|---|---|---|
| Protocols | Modbus TCP, BACnet/IP, S7, OPC UA, offline meters, Excel | Adds Modbus RTU, OPC DA, IEC 61850, IEC 101/103/104, vendor APIs, databases, MQTT/Kafka |
| Analysis | Energy, cost, carbon, load, efficiency, statistics, and comparison for seven object types | Saving analysis, plan analysis, carbon footprint, depending on prediction and plan components |
| Reports | Page reports, real xlsx with charts, AI conclusions | Advanced templates, schedules, email, graphics tools |
| Energy assets | Consumption-side metering and accounting | PV, storage, EV chargers, microgrids, virtual power plants |
| Diagnosis and control | FDD tables exist. AI gives advice | FDD, remote control, work orders |
| Publishing | REST, JSON import/export | BACnet, Modbus TCP, and OPC UA servers, MQTT, Kafka |
| Deployment | docker-compose. MySQL family including MariaDB, Percona, SingleStore, OceanBase | Kubernetes. SQL Server, Oracle, PostgreSQL |
| Branding | Name and logo may not be replaced | Custom branding by contract |
See the Community Edition and Enterprise Edition lists. For collect–analyze–report projects the Community Edition is often enough. Maintenance is concentrated in one company. Delivery should include the full source, schema scripts, upgrade notes, and a local build, kept on the owner's own repository.
Open source lowers license cost and exit cost. It does not replace metering quality, correct point binding, or an operations owner.
Chapter 5. Six capability domains
Collection. One service per protocol parses and converts types. Business meaning is object_type and object_id. Connection and address are two JSON documents (host, port, interval; slave, function code, offset, format, byte swap). Function codes 01, 02, 03, 04, and 23 are supported. Configuration is loaded at start, so a change requires a restart. Offline meters and Excel cover points that cannot be polled.
Monitoring. Seven object types share one aggregate set, at hour, day, month, and year, with year-on-year, period-on-period, and free comparison. Meters add live values, main/sub-meter balance, batch analysis, and power quality. Spaces add a dashboard, an energy-flow diagram, and distribution analysis. Intensity needs floor area, or products, teams, shifts, and output.
Accounting. Cost is energy times tariff. Carbon is energy times an emission factor. Time-of-use, tiered, demand, and power-factor charges are interpreted during aggregation. The seeded electricity factors, 0.123 kgce/kWh and 0.928 kgCO2e/kWh, are examples and must be replaced. Baselines, plans, and the 8,760-hour model are a second derivation. Full saving, plan, and prediction analysis is Enterprise.
Reports. openpyxl builds a real xlsx with tables and charts. Page reports read materialized tables, so response time depends on the selected period and object count, not on total volume. A free combination outside those dimensions should be a new table or a separate analytical store, not a scan during the request. Advanced reports add a template, a schedule, and email.
Configuration. The AngularJS admin UI maps almost field-for-field onto tables. Backing up the database backs up the business configuration.
Extensions. Community AI (DeepSeek and the OpenAI API) turns aggregates into conclusions and saving advice. A person must review them. Enterprise extends into PV, storage, chargers, microgrids, virtual power plants, remote control, FDD, work orders, graphics, mobile clients, and key-emitter uploads, plus MCP, LLM function calls, and AI skills.
| Domain | Core capability | Usual user | The project still supplies |
|---|---|---|---|
| Collection | Four industrial protocols, offline meters, Excel, data sources and points | Implementation, operations | Instruments, gateways, network, point-list check |
| Monitoring | Category, item, load, efficiency, statistics, comparison, balance, power quality | Energy manager, operators | Object register, area, output, agreed basis |
| Accounting | Cost, carbon, baseline, plan, 8760 model | Energy manager, finance | Local tariff, factors, baseline year |
| Reports | Page reports, xlsx, advanced templates and schedules | Management, group reporting | Templates, submission basis, mail gateway |
| Configuration | Spaces, meters, points, equipment, tariffs, privileges, calendars | Administrator | Coding rules, privilege design, backup |
| Extensions | AI conclusions; Enterprise PV/storage/microgrid/FDD/control | Analysts, maintenance | Device interfaces, control policy, security review |
Chapter 6. Architecture: five layers, thirteen databases, two paths
Five layers: collection, storage, computation, service, and presentation, with privileges, configuration, languages, logs, containers, and multi-database support beside them.
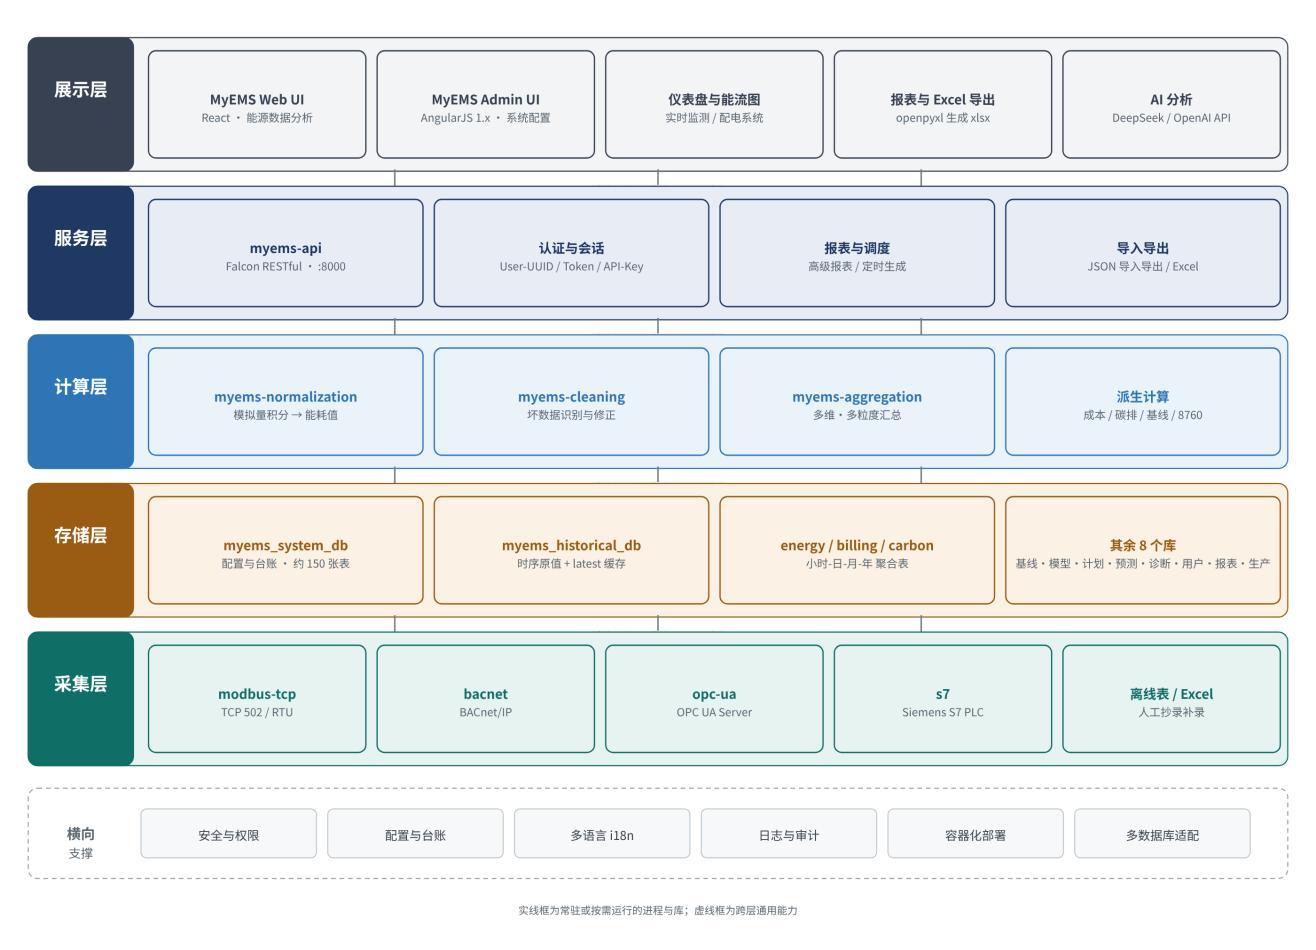
Components do not call each other. Collectors write history. Computation reads history and writes results. The API reads everything. The configuration database is read by collection, computation, authentication, and reporting.
| Component | Runtime | Stack | Role | Port |
|---|---|---|---|---|
| myems-database | Scripts | MySQL DDL | 13 databases, tables, seed data | none |
| myems-api | Service | Python, Falcon, gunicorn or waitress, openpyxl | REST, auth, reports, Excel | 8000 |
| myems-admin | Static | AngularJS 1.x, nginx | Master data and collection configuration | 8001 |
| myems-web | Static | React 16, ECharts, Chart.js, i18next, nginx | Analysis | 80 |
| myems-modbus-tcp | Collector | Python, modbus_tk, schedule | Modbus TCP/RTU | none |
| myems-bacnet | Collector | Python, BACnet/IP | Building automation | none |
| myems-opc-ua | Collector | Python, OPC UA | OPC UA client | none |
| myems-s7 | Collector | Python, S7 | Siemens PLC | none |
| myems-normalization | Batch | Python, mysql-connector, schedule | Raw values to hourly energy | none |
| myems-cleaning | Batch | Python, schedule | Flag and correct bad data | none |
| myems-aggregation | Batch | Python, mysql-connector | Multi-dimensional aggregates and derived accounting | none |
Collectors need a route to the field subnet. Opening 80, 8001, 8000, and 3306 is not enough.
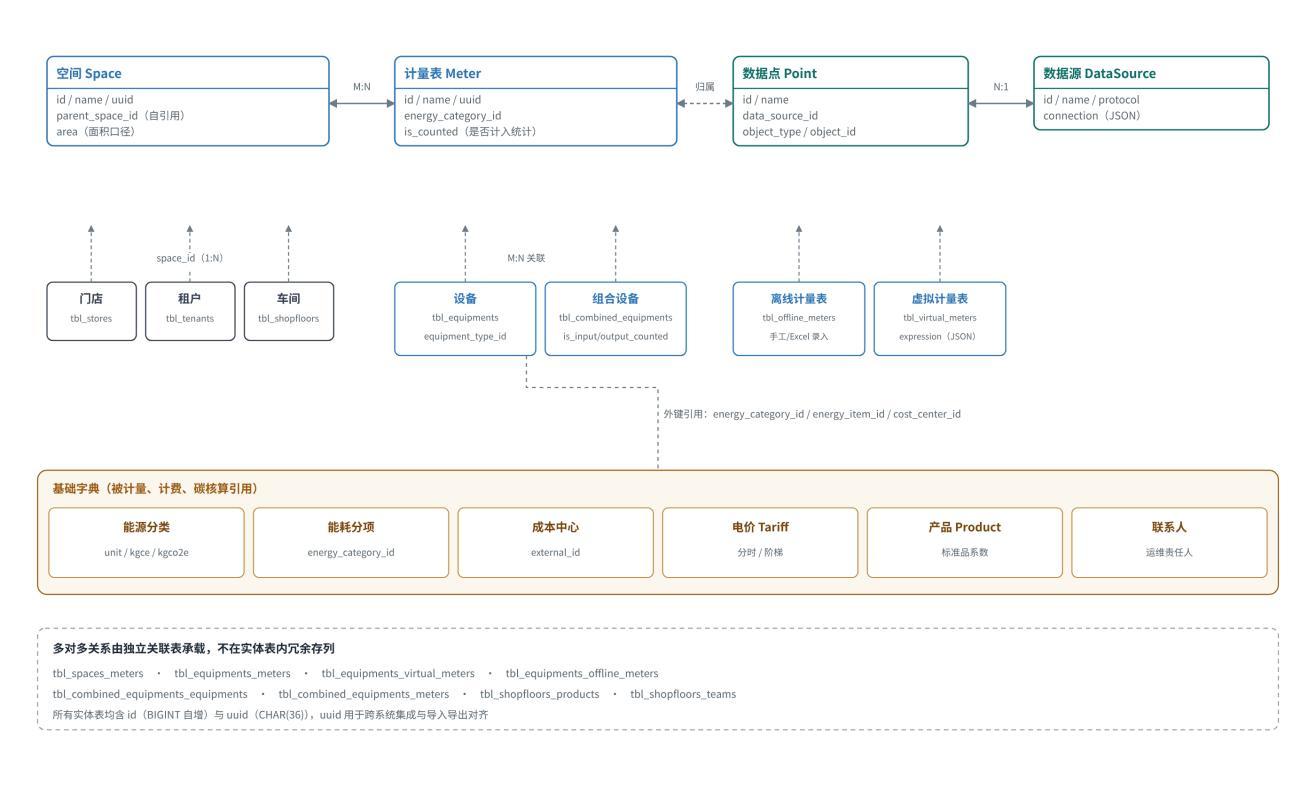
A data source produces points. A point belongs to a meter or equipment. A meter belongs to a space and an energy category. Spaces form a tree. Stores, tenants, and shopfloors hang on the tree. Combined equipment groups equipment and meters. Many-to-many links live in association tables. “Lighting electricity of this floor this month” is a tree walk, an association expansion, and an item filter, which is why aggregates are materialized instead of joined at request time.
| Group | Database | Purpose | Scale |
|---|---|---|---|
| Configuration | myems_system_db | Categories, items, spaces, meters, equipment, points, sources, tariffs, commands | About 150 tables, small volume |
| Configuration | myems_user_db | Users, privileges, sessions, API keys, audit, notifications | Small, high security |
| Raw | myems_historical_db | Raw series, latest cache, file tables | Largest |
| Aggregate | myems_energy_db / billing / carbon | Energy, priced cost, factored carbon, same shape | Grows with objects and dimensions |
| Derived | baseline, model, plan, prediction | Baselines, 8,760-hour model, plans, forecasts | Small, or 8,760 rows per object |
| Supporting | fdd, reporting, production | Rules and messages, report files, products and output | Small |
L0 is append-only raw points. L1 is meter-level energy. L2 is dimensional aggregates. L3 is derived accounting. A factor change reruns L3. A wrong binding reruns from L1. Only a collection error returns to L0.
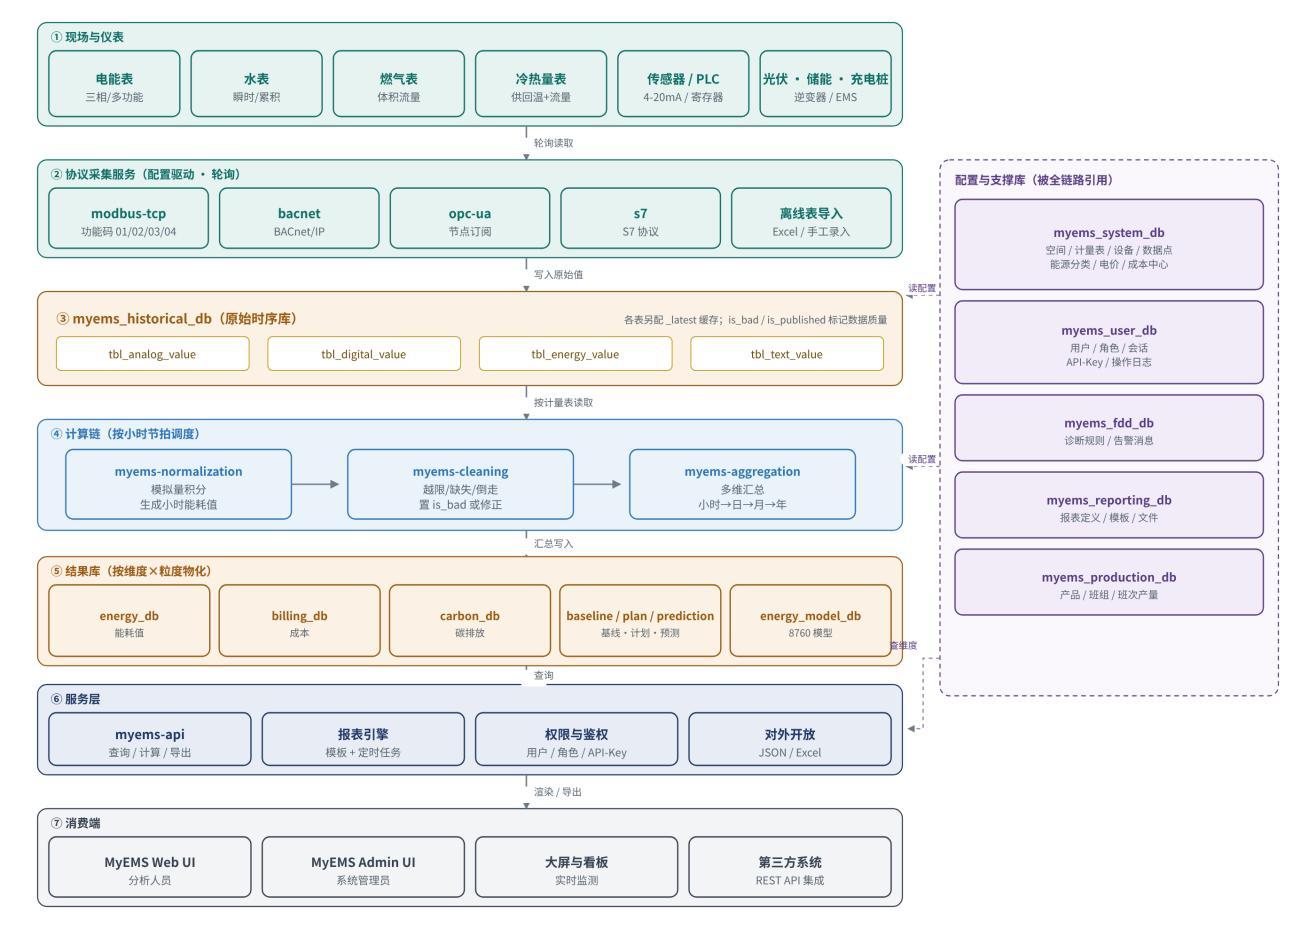
The path is field read, protocol parse, raw insert, normalization, cleaning, aggregation, and query. A wrong meter-to-point binding propagates into cost and carbon without a later error. Cleaning follows normalization. Aggregation writes energy, cost, and carbon from one read. Collection is on the order of minutes, computation is hourly, and reports are request-scoped, so a report usually lags by one period. That lag is by design.
Timestamps are UTC (utc_date_time, start_datetime_utc). Numbers are DECIMAL(21,6). Identity is id plus uuid. Quality flags are is_bad, is_published, is_counted, and is_enabled. Requests carry a user id and a token, or an API key, and fail with 401. There is no organization-level row filter. Import and export move a full topology and align objects by uuid.
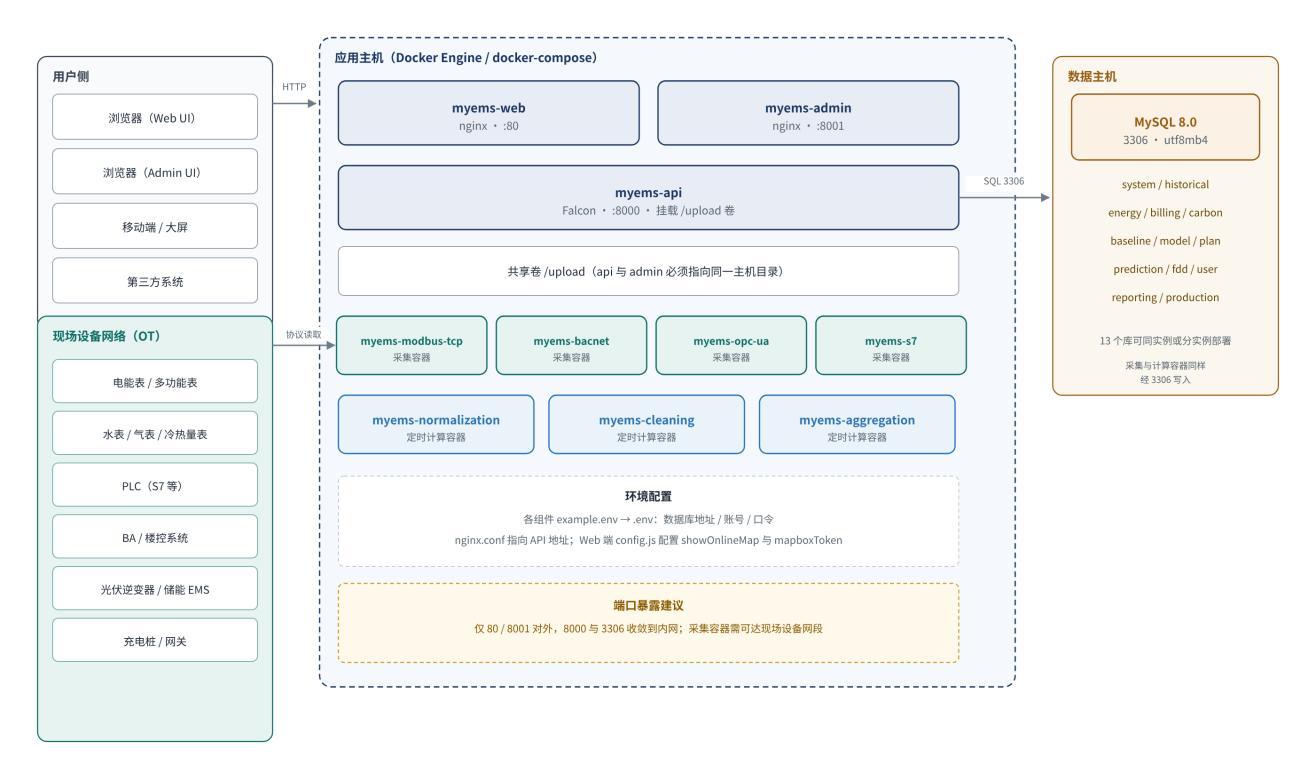
docker-compose and systemd install the same components. The application host exposes 80 and 8001. Ports 8000 and 3306 stay internal. api and admin must share the upload volume. Collection should use two networks, IT and OT, with no routing between them. After deployment, check API version, login, one analysis page, and one collected value.
At 3,000 points and a 15-minute interval, growth is about 288,000 rows a day, about 105 million rows a year, and about 3.9 GiB a year including indexes. A 1-minute interval multiplies that by 15. At 500 objects, 4 grains, and 2 classifications, hourly aggregates are about 4.38 million rows a year. (Estimate.) The database is the single point of a single-host deployment. Change the default password, rate-limit and terminate TLS at the proxy, and do not grant the application DDL. There is no built-in second factor, full log retention, or data masking.
Chapter 7. Trade-offs and where the product fits
| Decision | Choice | Why | Cost |
|---|---|---|---|
| Integration | Shared tables, no message broker | Simple, offline, nothing extra to operate | Schema is the contract |
| Collection | Periodic polling | No change on the device | Freshness is the interval |
| Computation | Hourly materialization | Fast reports, recomputable results | A basis change is a rerun |
| Data placement | 13 databases by purpose | Clear backup boundaries | No cross-database foreign keys |
| SQL | The shared subset only | MySQL family, SQL Server, Oracle, PostgreSQL | No window functions, JSON functions, or native partitioning |
| Time and numbers | UTC and DECIMAL(21,6) | Comparable across time zones, no binary drift | Local calendar edges are corrected in presentation |
| Privileges | Per user, no row filter by organization | Simple | Multi-tenant isolation is the space tree, or a separate instance |
| Front ends | React for analysis, AngularJS 1.x for admin | Analysis can move, admin stays stable | Two stacks. AngularJS left long-term support at the end of 2021 |
A shared database means no broker and no service discovery. It also means the newest report value lags by one period. Daily and monthly allocation, assessment, and submission fit. Second-level load control, microgrid switching, and fault recording do not. Alarms are evaluated on a cycle, so they are delayed by minutes. Millisecond interlocking belongs to field protection.
New dimensions need new tables. Tariff and factor changes need an explicit rerun scope: derived layer, normalization layer, or raw backfill. Prefer daily full backups of configuration, incremental backups of raw history, and weekly backups of data that can be rebuilt.
| Project trait | Fit | Why |
|---|---|---|
| One campus, plant, hospital, or complex, deployed privately | Prefer | One host, a clear operations boundary |
| No public network | Prefer | No external dependency |
| Budget should move from licenses to metering and implementation | Prefer | No license fee |
| Tenants, stores, or shopfloors | Prefer | Seven object types share aggregates |
| Thousands to tens of thousands of points, daily/monthly/yearly management | Prefer | Cadence and single-host capacity match |
| Extension or integration with an existing system | Prefer | Code, tables, and REST are visible |
| Second-level control or interlocking | Outside | Polling and hourly batches cannot do it |
| Trade settlement or legal metrology | Outside | No legal-metrology certification. Accuracy sits with the meter |
| Multi-tenant SaaS or very large central hosting | Outside | No row-level organization filter. One database write path |
| Graded protection level 3 or a classified environment | Can be added | Second factor, full audit retention, and masking are extra |
| Deep graphics and process animation | Outside | Graphics tools are Enterprise and limited |
| No local operations, and a 24×7 vendor response is required | Can be added | Community support is group chat. An SLA is a separate contract |
Five checks before a project starts: accept the one-period lag; fund the metering retrofit; name who provides database high availability; name who operates the system two years later; and decide branding before acceptance, using an Enterprise authorization if the integrator's brand must replace MyEMS.
Chapter 8. Scenarios and implementation
Complexes fail on allocation. Main meter, sub-meters, and tenant meters must be designed before instruments are installed. Factories fail on ownership: unit-product energy needs products, teams, shifts, and output recorded as they happen, not backfilled at month end. Hospitals care first about continuity of critical circuits. Store chains care about comparability, so area, hours, and metering must be the same in every store. Energy-carbon centers care about factor versions and submission templates. The Enterprise Edition adds uploads for key energy-using organizations.
| Stage | Work | Deliverable | Typical failure |
|---|---|---|---|
| Charter | Goals, basis, scope, acceptance | Requirements, point list, acceptance clauses | “Build an energy platform” cannot be accepted |
| Metering and register | Survey, install or replace meters, build the object register | Meter register, space tree, categories and items | Meters and the register diverge |
| Collection | Deploy, configure sources and points, check each point | Point cross-reference, completeness report | Addresses point at the wrong meter |
| Basis and trial | Freeze tariff, factors, and allocation. Run three chains | Basis note, trial reports, variance analysis | The basis keeps moving |
| Acceptance and training | Verify clauses, hand over documents | Acceptance report, operations manual, training record | Functions pass and the data does not |
| Operations | Watch collection and aggregation, fix exceptions | Operations log, monthly quality report | Nobody owns it after six months |
Metering precedes collection. The basis is frozen before trial operation. Training precedes acceptance.
| Acceptance item | Method | Usual dispute |
|---|---|---|
| Completeness | 20 random points, hourly values for 7 days, missing rate under the agreed threshold | Whether a communication outage counts |
| Binding | A deliberate load change moves the matching curve | Shared meters |
| Balance | Difference rate of main meter and sub-meters on 3 typical days | Whether loss and unmetered load are allowed |
| Units and factors | Units, coal-equivalent factors, and emission factors match the local basis | Sample factors left in place |
| Report basis | One monthly and one yearly report checked against the manual ledger | UTC versus local calendar |
| Export | xlsx tables and chart objects are complete | Chart and table disagree |
| Privileges and audit | A read-only account cannot change configuration. The audit log records the attempt | Retention shorter than internal audit |
| Performance | One query and one export at the maximum object count and longest period | Trial data much smaller than production |
Sign one confirmation for tariff, allocation, and emission factors before trial operation. Data used for settlement, government submission, or subsidies must come from calibrated instruments. Daily, check last-write time per point. Weekly, check main/sub-meter balance. Monthly, check that hour, day, and month aggregates have advanced. Manual corrections need a reason. Bad periods show a gap, not a zero. A meter replacement records the time and the new register.
Five project failures are independent of the software: scaling a best-case pilot to the whole site at once; installing software before meters; publishing reports before the basis is frozen; no operations budget after acceptance; and customizing the admin UI until upgrades cannot merge.
Chapter 9. Cost, benefit, and when to wait
The following is an author's estimate for a campus of about 3,000 points. Replace every coefficient with a project quote.
| Item | CNY 10,000 | Contents |
|---|---|---|
| Meters and retrofit | 40 | About 200 meters, gateways, outages, calibration |
| Implementation | 35 | Survey, point check, configuration, reports, commissioning, training |
| Servers and network | 8 | Application host, database host, switch, second NIC |
| Training and documents | 4 | Administrator training, operations manual, basis note |
| Management and contingency | 13 | Coordination, supervision, contingency |
| Total | 100 | Excludes Enterprise license and branding |
Annual run cost in the example is 350,000 CNY: 120,000 of services, 0.7 internal staff at 210,000, and 20,000 of hosting and consumables. Three-year total cost of ownership is about 2.05 million CNY. A commercial license at this scale is often 300,000 to 600,000 CNY, plus 15% to 20% annual maintenance. The open-source advantage is that the license does not step up with point count. (Estimate.)
Saving comes from operating changes, maintenance, and retrofit, not from the software. The example uses 3%, 5%, and 8%. Cost optimization in the example is about 80,000 CNY from demand, 120,000 from shifting peak load (conservative), 40,000 from power factor, and 80,000 from automated reconciliation, about 320,000 CNY together. Indirect emissions at 20 million kWh and the 2022 national grid factor 0.5703 kg/kWh are about 11,406 tonnes. At an internal carbon price of 80 CNY/t that is a shadow cost of about 910,000 CNY a year, not cash. (Estimate.)
Savings require a counterfactual baseline, usually the full year before the project, normalized for output, area, hours, degree-days, or occupancy, with the same metering boundary before and after. Count only what can be attributed. The system supplies the data. It does not prove the saving.
Assumptions: 20 million kWh, 0.85 CNY/kWh, 1 million CNY invested, 350,000 CNY a year to run, 320,000 CNY of non-saving benefit, 8% discount rate, no residual value. (Estimate.)
| Scenario | Saving rate | Annual saving | Annual net | Simple payback | 3-year net cash | 5-year NPV |
|---|---|---|---|---|---|---|
| Conservative | 3% | 510,000 | 480,000 | 2.1 years | 440,000 | 917,000 |
| Base | 5% | 850,000 | 820,000 | 1.2 years | 1,460,000 | 2,274,000 |
| Upside | 8% | 1,360,000 | 1,330,000 | 0.8 years | 2,990,000 | 4,310,000 |
All figures in the table are thousands of CNY except the payback. At 17 million CNY of annual electricity cost, 3% covers the investment. At 5 million CNY, the 3% case is about zero after operating cost. All three scenarios assume the retrofit finishes, the basis is frozen once, and someone operates the system.
Plan for 2 to 3 times the starting object count. Survey every circuit before pricing meters. Budget a person who checks collection daily, balance weekly, reports monthly, and the basis yearly.
Wait if annual electricity cost is under 1 million CNY and there is no allocation or external reporting need; if the meters are too poor and there is no retrofit budget; if the need is real-time control; or if nobody owns the result and there is no assessment.
Chapter 10. Selection
| Dimension | Commercial EMS | SCADA extension | IoT platform, custom apps | Time-series database plus BI | MyEMS |
|---|---|---|---|---|---|
| License | High, stepped by point and module | Medium | Medium to high | Low | None. Cost is implementation and metering |
| Protocols | Usually broad | Strong industrial coverage | Strong, via gateways | Weak. Collection is custom | Four industrial protocols. Enterprise adds RTU, IEC, vendor APIs |
| Accounting | Medium to high | Low, custom | Low, custom model | Low, hand-built | Three chains built in |
| Objects | Often space and cost center | Circuits and equipment | Flexible if you build it | No master data | Seven types, shared aggregates |
| Customization | Inside the product boundary | High, depends on the integrator | High, needs a development team | High, large effort | High. Code and tables are visible |
| Time to first version | 3–6 months | 3–9 months | 6–12 months | 1–3 months | 1–3 months |
| Offline and domestic IT | Varies | Intranet | Often cloud-native | Supported | Intranet, offline, domestic databases |
| Support | SLA | The integrator | Platform vendor plus your team | None | Community. SLA is a separate contract |
| Portability | Vendor-limited | Depends | Platform lock-in risk | High | High. Standard tables and JSON |
| Scale | Depends on the product | Small to medium | Large | Depends on the design | Thousands to tens of thousands of points in one project |
| Question | If yes | If no |
|---|---|---|
| Second-level control or interlocking? | Use a control system. The management system only records | Continue |
| Trade settlement or legal metrology? | Use a certified metering system | Continue |
| Tenants, stores, or shopfloors? | MyEMS or a commercial system with the same object model | A light monitor or time-series plus BI is enough |
| Zero license cost and portable data? | MyEMS first | A commercial system is simpler |
| Annual electricity cost above 10 million CNY? | Payback of a full system is usually acceptable | Count allocation and reporting value, or stay light |
| Intranet, offline, or domestic-IT requirement? | MyEMS or another private deployment | A cloud service can work |
| PV, storage, chargers, microgrid, or a virtual power plant? | Enterprise, or a specialist system | Community Edition is enough |
| 24×7 vendor response and penalties? | A service contract, or a commercial system | Community support is acceptable |
| Staff who can configure and operate? | Self-implementation is the cheapest | Buy implementation and operations |
| Deliver under another brand? | Enterprise branding authorization | Keep the MyEMS marks |
The first two questions are stop rules. The next five choose the kind of system. The last three are commercial.
Contracts should attach the meter boundary, the accounting basis and factor sources, and the acceptance method. Open-source delivery should include source, schema scripts, upgrade notes, and a local build, plus ownership of modifications. Say who upgrades, and how a failed upgrade rolls back. Split the service level into data continuity, report timeliness, and fault response.
Community Edition marks, logo, and page title must stay. MIT is not a trademark license. Review dependency licenses before commercial delivery. The product does not send data out, except AI analysis, which submits aggregates to a model provider. Sensitive projects should turn that off.
Owners should ask first whether the three chains can run on their own basis. Integrators should treat MyEMS as a delivery base, not a rebranded product, and say at quotation time that the Community Edition cannot be rebranded. Developers should read the tables before the code, and extend the existing object model.
Chapter 11. Risk, direction, and conclusion
Put new configuration screens on React and treat admin migration as a long-term task. Do not expect later versions to remove the freshness ceiling. Archive raw and aggregate data before year two or three, with an explicit retention period and rerun window. For a group, deploy one instance per project or isolate with views. Leave exploratory queries to BI.
Maintenance is concentrated. Keep a runnable branch, and train at least two people who can read the tables and the configuration. Group chat is not an SLA.
Graded protection needs extra controls at the proxy and the application. Legal and subsidy figures must come from calibrated instruments. Classified or cross-border-restricted projects should not call an external model. Do not replace the Community Edition brand. Do not advertise under the MyEMS name without permission.
AI output is a reading aid. Label it as generated and requiring review, and show the data behind the sentence. If a model can call system functions, require an audit trail, a command allow-list, and a human confirmation.
Likely directions are partitioning and incremental reruns, row-level and organization isolation, API rate limits and richer queries, one front-end stack, and deeper energy-asset and model integration. A group platform can isolate data and privileges by organization, rerun any period without rebuilding the database, and keep collection and aggregation on time across many points and projects.
MyEMS concentrates three advantages: seven object types share one aggregate set; energy, cost, and carbon share one energy value; the MIT license and standard tables mean the data and the configuration can leave with the owner. It is for multi-dimensional accounting on a daily and monthly cycle.
A project succeeds or fails on metering, a frozen basis, and a person who takes it over. Start with a complete meter survey: every circuit, its meter, its owner, its basis, and the person responsible. The quality of that register sets the ceiling after go-live.
References
- Beijing Haisoft Software Co., Ltd. MyEMS architecture design document, v6.9.0, October 2026.
- MyEMS website, https://myems.cn, accessed 31 October 2026.
- Community Edition feature list, accessed 31 October 2026.
- Enterprise Edition feature list, accessed 31 October 2026.
- Source repository, https://gitee.com/myems/myems, accessed 31 October 2026.
- General Office of the State Council. Work plan for building a dual-control system for carbon emissions (Guo Ban Fa [2024] No. 39), 30 July 2024.
- Ministry of Ecology and Environment and others. Work plan to cover steel, cement, and aluminum smelting in the national carbon market, and related Q&A, March 2025.
- National carbon-market operating results, Ministry of Ecology and Environment, July 2025.
- GB/T 23331-2020, Energy management systems — Requirements with guidance for use. Published 19 November 2020, effective 1 June 2021.
- Ministry of Ecology and Environment. 2022 national average CO2 emission factor for electricity, published 2024.
- MIT License, distributed with the repository.
- IPMVP public material, used as the method frame for Chapter 9.